Story Highlights
- Croydon had total Property Sales of £2.24 billions in 2016
- The total number of properties sold in year 2016 was 5,696
- The Average property price was £393 K in Croydon, while Median was £332 K
- Not New Property contributed 92.18% and New Property 7.82% by sales value
- Stamp duty changes caused monthly spike in March
- Brexit coupled with Stamp Duty have played significant role in decline of 8.6% (total sales value)
Croydon is one of the Boroughs of South London. It had total Property Sales of £2.24 billions which was 15.69% of South London Property Market 2016.
Total Sales By Property Type
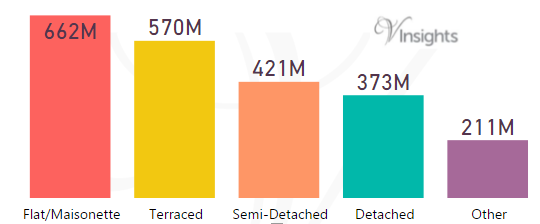
The split of of £2.24 billions across the different property types are:
- Flat/Maisonette £662 millions (29.59%)
- Terraced £570 millions (25.47%)
- Semi-Detached £421 millions (18.85%)
- Detached £373 millions (16.68%)
- Other £211 millions (9.42%)
Year on Year Comparison : Compared to Croydon Property Market 2015 in 2016
- All the property types have shown decline in sales except Terraced
- Terraced has shown a very nominal growth of 0.9% in total sales value
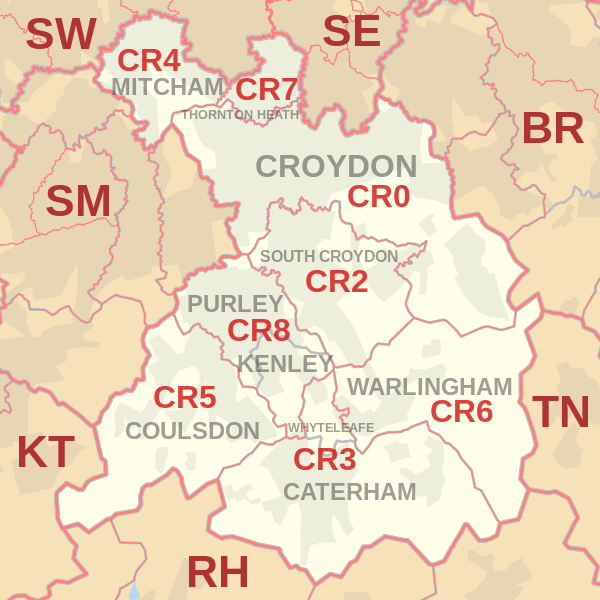
Croydon Property Market at Postcode Level
 |
| Postcode |
Coverage Area
|
Local Authority Area |
| CR0 |
Croydon, Addiscombe, Woodside (part), Selhurst, Broad Green, Spring Park, Shirley, Addington, New Addington, Coombe, Forestdale, Waddon, Beddington, Thornton Heath (part)
|
Croydon, Sutton |
| CR2 |
South Croydon, Sanderstead, Selsdon, part of Addington
|
Croydon |
| CR3 |
Caterham, Chaldon, Woldingham, Whyteleafe, Hamsey Green
|
Tandridge, Croydon |
| CR4 |
Mitcham, Mitcham Common, Pollards Hill, Eastfields, Beddington Corner
|
Merton, Sutton, Croydon |
| CR5 |
Coulsdon, Old Coulsdon, Chipstead, Hooley, Netherne-on-the-Hill, part of Woodmansterne, Clockhouse
|
Croydon, Reigate and Banstead, Sutton |
| CR6 |
Warlingham, parts of Chelsham and Farleigh, Hamsey Green
|
Tandridge, Croydon, Bromley |
| CR7 |
Thornton Heath, Broad Green (part)
|
Croydon, Merton |
| CR8 |
Purley, Kenley, Russell Hill
|
Croydon, Sutton, Tandridge |
| CR9 |
Shirley
|
Croydon |
| SE19 |
Upper Norwood, Crystal Palace
|
Bromley, Croydon, Lambeth, Lewisham, Southwark |
| SE25 |
South Norwood, Selhurst (part), Thornton Heath (part), Woodside (part)
|
Croydon |
| SW16 |
Streatham, Streatham Common, Norbury, Thornton Heath, Streatham Park, Furzedown, Streatham Vale, Mitcham Common, Pollards Hill, Eastfields
|
Croydon, Lambeth, Merton, Wandsworth |
For property market details at post code level please click on Postcode in the table above.
Month-wise Break-up of Total Sales
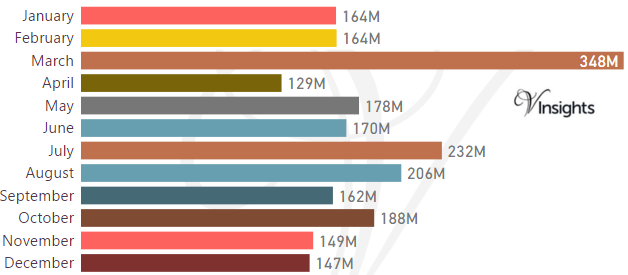
Stamp Duty Hike Impact
- March had property sale spike of £348 millions compared to £164 millions in Feb
- The impetus for it was to avoid the extra 3% in Stamp Duty Tax applicable on buying an additional home, being applicable from April 1 2016
Brexit Impact
- Brexit took place on 23rd June 2016.
- As can be observed from the month-wise break-up there does not seem to have been significant dip in property sales in the immediate aftermath of Brexit
- Year on Year the property market for Croydon has shown a decline of 8.6% over 2015
Total No Of Properties Sold By Property Type
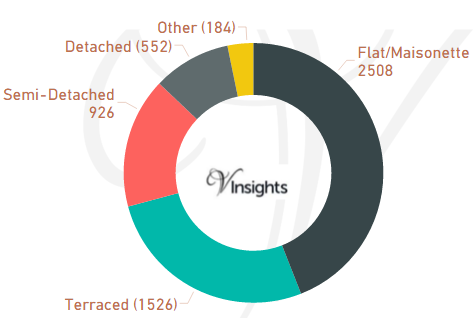
In Croydon the total number of properties sold in year 2016 was 5,696. The breakdown by different property types are:
- Terraced 1,526 (26.79%)
- Semi-Detached 926 (16.26%)
- Other 184 (3.23%)
- Flat/Maisonette 2,508 (44.03%)
- Detached 552 (9.69%)
Year on Year Comparison : Compared to Croydon Property Market 2015 in 2016
- Total number of property sales in Croydon has declined by 11.36% in 2016
- All property types have shown decline in number of properties sold except property type Other
- Other has shown significant increase of 66% over 2015
Average & Median Sales Price
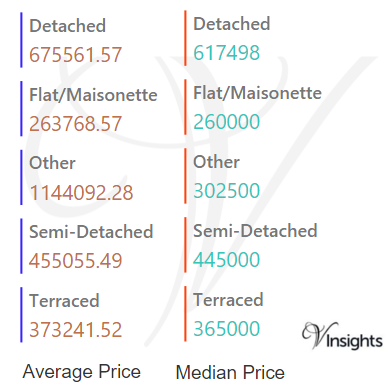
In 2016 the Average property price was £393 K in Croydon. The average property price for the different property types are:
- Detached £676 K
- Flat/Maisonette £264 K
- Other £1.14 millions
- Semi-Detached £455 K
- Terraced £373 K
The Median Price was £332 K. The median property price for the different property types are:
- Detached £618 K
- Flat/Maisonette £260 K
- Other £303 K
- Semi-Detached £445 K
- Terraced £365 K
Year on Year Comparison : Compared to Croydon Property Market 2015
- The average and median sales price across all property types have gone up except for others
- Others have shown sharp decline in average and median sales price
New Vs Not New Property Statistics
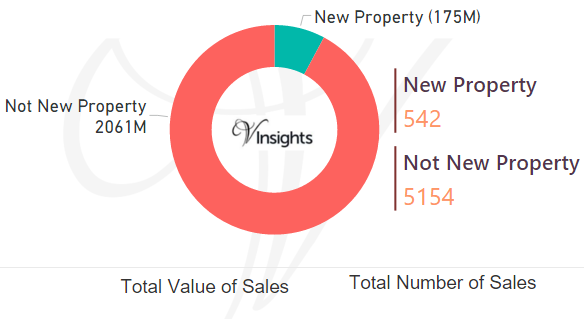
By Value Of Sales
- Not New Property contributed £2.06 billions (92.18%)
- New Property £175 millions (7.82%) giving
By Number Of Sales
- The number of Not New Property sold was 5,154 (90.48%)
- The number of New Property sold was 542 (9.52%)
Year on Year Comparison : Compared to Croydon Property Market 2015 in 2016
- New property market share in property market has not changed much in 2016 over 2015
All London Posts
9c7a3229-c926-4191-b45b-c60fb8b37711|0|.0|27604f05-86ad-47ef-9e05-950bb762570c