13. February 2018 18:01
/
VInsights Team
/
/
Comments (0)
Please click here for the updated version of this post
This Post covers
- Coverage Area of Postcode N1 to N9
- Total Values of Properties Sold in 2017
- Average Sales Price in 2017
- Median Sales Price in 2017
- Standard Deviation of Sales Price in 2017
- Total Number of Properties Sold in 2017
- Total Number of Buy-To-Let Properties in 2017
- Multi Year Property Trend Analysis
- Schools for Postcode Area N
- Posts for Postcode Area N
Coverage Area of Postcode N1 to N9 Property Sales
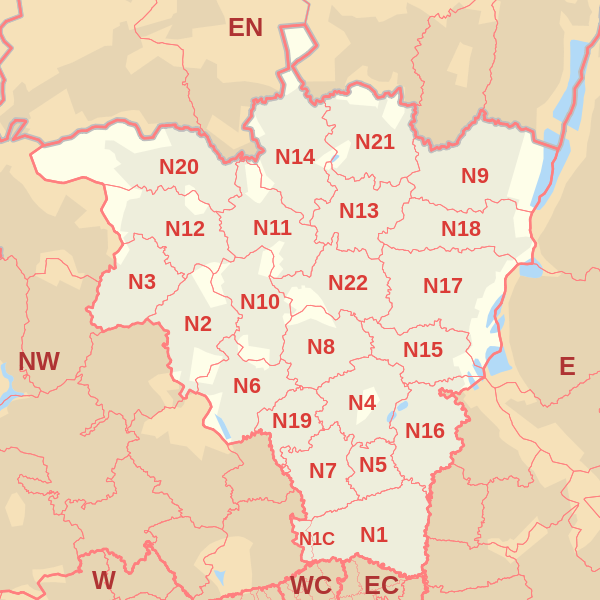 |
| Postcode |
Coverage Area |
Local Authority Area |
| N1 |
Barnsbury (part), Canonbury, Kings Cross, Islington, Pentonville, De Beauvoir Town, Hoxton |
Hackney, Islington, Camden |
| N1C |
Kings Cross Central |
Camden |
| N2 |
East Finchley, Fortis Green, Hampstead Garden Suburb (part) |
Barnet, Haringey |
| N3 |
Finchley, Church End, Finchley Central |
Barnet |
| N4 |
Finsbury Park, Manor House, Harringay (part), Stroud Green (part) |
Haringey, Islington, Hackney |
| N5 |
Highbury, Highbury Fields |
Islington, Hackney |
| N6 |
Highgate, Hampstead Heath (part) |
Camden, Haringey, Islington |
| N7 |
Holloway, Barnsbury (part), Islington (part), Tufnell Park (part) |
Islington, Camden |
| N8 |
Hornsey, Crouch End, Harringay (part) |
Haringey, Islington |
| N9 |
Lower Edmonton, Edmonton (part) |
Enfield |
Total Value of Properties Sold in 2017
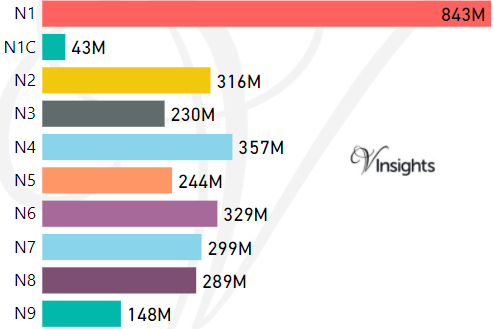
*M represents millions
*Total value includes Property Type Other apart from Detached, Semi-Detached, Terraced, Flat/Masionette
Average Sales Price in 2017
| Postcode |
Detached |
Semi-Detached |
Terraced |
Flat |
| N1 |
£2217K |
£2929K |
£1481K |
£624K |
| N1C |
|
|
|
£1097K |
| N2 |
£3462K |
£1324K |
£964K |
£953K |
| N3 |
£1399K |
£881K |
£711K |
£523K |
| N4 |
£1635K |
£1322K |
£951K |
£511K |
| N5 |
£1880K |
£1900K |
£1426K |
£579K |
| N6 |
£3304K |
£2364K |
£1617K |
£703K |
| N7 |
£1650K |
£2224K |
£966K |
£499K |
| N8 |
£2280K |
£1132K |
£1035K |
£500K |
| N9 |
£422K |
£428K |
£364K |
£220K |
Median Sales Price in 2017
| Postcode |
Detached |
Semi-Detached |
Terraced |
Flat |
| N1 |
£2700K |
£2190K |
£1400K |
£559K |
| N1C |
|
|
|
£1035K |
| N2 |
£2400K |
£1200K |
£875K |
£440K |
| N3 |
£1250K |
£830K |
£705K |
£480K |
| N4 |
£1635K |
£1236K |
£900K |
£490K |
| N5 |
£1155K |
£1875K |
£1450K |
£530K |
| N6 |
£2775K |
£1750K |
£1450K |
£600K |
| N7 |
£1650K |
£1725K |
£950K |
£480K |
| N8 |
£1250K |
£1240K |
£997K |
£490K |
| N9 |
£415K |
£416K |
£367K |
£214K |
Standard Deviation of Sales Price in 2017
| Postcode |
Detached |
SemiDetached |
Terraced |
Flat |
| N1 |
£970K |
£1690K |
£628K |
£292K |
| N1C |
|
|
|
£508K |
| N2 |
£2593K |
£409K |
£395K |
£2018K |
| N3 |
£518K |
£266K |
£183K |
£190K |
| N4 |
|
£472K |
£290K |
£198K |
| N5 |
£1025K |
£35K |
£619K |
£238K |
| N6 |
£1693K |
£1513K |
£846K |
£422K |
| N7 |
|
£1234K |
£385K |
£203K |
| N8 |
£1457K |
£471K |
£355K |
£183K |
| N9 |
£48K |
£51K |
£61K |
£45K |
For example,
- Say the average detached property price for postcode XYZ is £300 K and ST. DEV. is £30 K.
- It means that most detached properties in postcode XYZ (about 68%) has price within one ST. Dev. i.e. the price range is £270K - £330K.
- All-most all detached property price (95%) in postcode XYZ lie between two ST. Dev. i.e. £240 K - £360 K
Total Number of Properties Sold in 2017
| Postcode |
Detached |
Semi-Detached |
Terraced |
Flat |
| N1 |
3 |
15 |
146 |
600 |
| N1C |
0 |
0 |
0 |
39 |
| N2 |
23 |
50 |
47 |
100 |
| N3 |
22 |
64 |
38 |
118 |
| N4 |
1 |
8 |
100 |
410 |
| N5 |
2 |
2 |
66 |
198 |
| N6 |
13 |
20 |
48 |
163 |
| N7 |
1 |
6 |
36 |
317 |
| N8 |
2 |
25 |
122 |
230 |
| N9 |
5 |
43 |
204 |
118 |
Total Number of Buy-To-Let Properties in 2017
The Table below gives in percentage, the total number of properties purchased as Buy-To-Let.
| Postcode |
Detached |
Semi-Detached |
Terraced |
Flat |
| N1 |
0% |
0% |
7% |
10% |
| N1C |
0% |
0% |
0% |
15% |
| N2 |
43% |
6% |
4% |
7% |
| N3 |
0% |
9% |
18% |
12% |
| N4 |
0% |
0% |
10% |
16% |
| N5 |
50% |
0% |
6% |
2% |
| N6 |
0% |
0% |
6% |
9% |
| N7 |
0% |
17% |
11% |
14% |
| N8 |
0% |
20% |
5% |
9% |
| N9 |
20% |
33% |
28% |
18% |
*Buy-to-let consists of Buy-to-lets (where they can be identified by a Mortgage) ,transfers to non-private individuals, transfers under a power of sale/repossessions
Multi Year Property Trend Analysis By Postcode
Schools for Postcode Area N
- London N Postcode Area - N1, N1C, N2, N3, N4, N5, N6, N7, N8, N9 School Details
- London N Postcode Area - N10, N11, N12, N13, N14, N15, N16, N17, N18, N19 School Details
- London N Postcode Area - N20, N21, N22 School Details
Posts for Postcode Area N
All N Postcodes Yearly & Trend Analysis Posts

Reference
N Postcode Area As Per Wikipedia
f0a2d14c-108c-4fff-9516-94f0b33f4a91|0|.0|27604f05-86ad-47ef-9e05-950bb762570c
Tags :