27. February 2018 16:51
/
VInsights Team
/
/
Comments (0)
Please click here for the updated version of this post
This Post covers
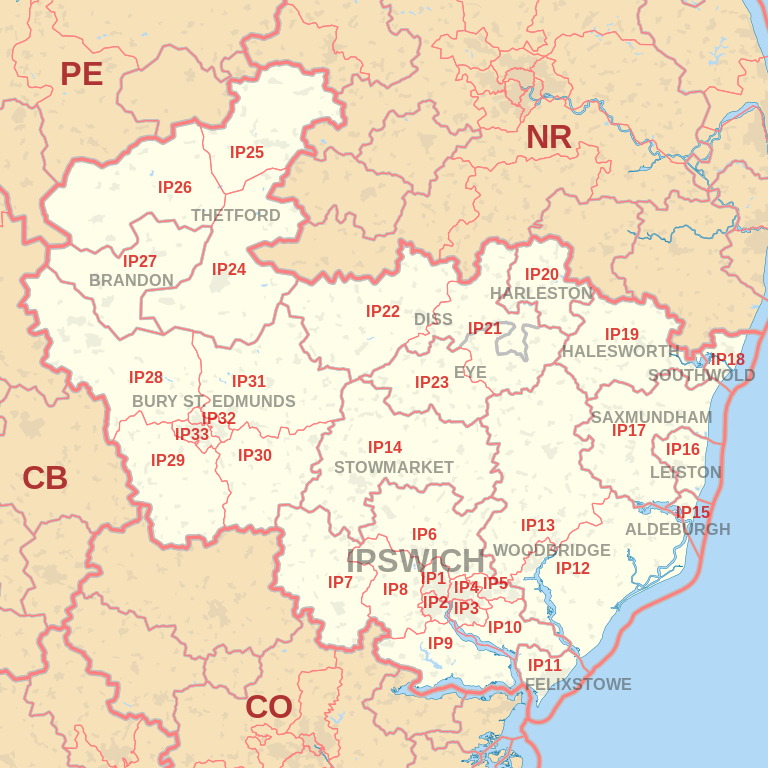 |
| Postcode |
Coverage Area |
Local Authority Area |
| IP1 |
North West Ipswich, Akenham |
Ipswich |
| IP2 |
South West Ipswich, Belstead, Wherstead, Stoke Park |
Ipswich |
| IP3 |
South East Ipswich, Ravenswood |
Ipswich |
| IP4 |
North East Ipswich |
Ipswich |
| IP5 |
Rushmere St Andrew, Kesgrave, Martlesham Heath |
Suffolk Coastal |
| IP6 |
Needham Market, Creeting St. Mary, Barham,
Henley, Claydon, Witnesham |
Mid Suffolk, Suffolk Coastal |
| IP7 |
Hadleigh |
Babergh |
| IP8 |
Copdock, Belstead |
Babergh |
| IP9 |
Shotley Peninsula: Capel St Mary, Chelmondiston, Shotley |
Babergh |
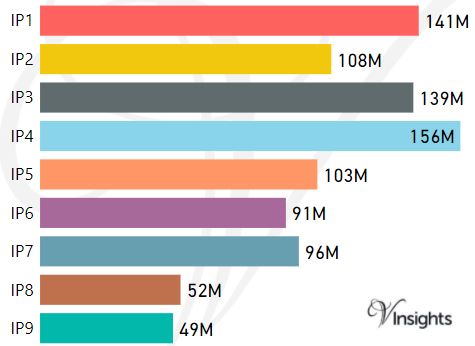
- M represents Million Pounds
- Total value includes Property Type Other apart from Detached, Semi-Detached, Terraced, Flat/Masionette
- IP Postcode Area - IP1, IP2, IP3, IP4, IP5, IP6, IP7, IP8, IP9 School Details
- IP Postcode Area - IP10, IP11, IP12, IP13, IP14, IP15, IP16, IP17 School Details
- IP Postcode Area - IP18, IP19, IP20, IP21, IP22, IP23, IP24, IP25, IP26 School Details
- IP Postcode Area - IP27, IP28, IP29, IP30, IP31, IP32, IP33 School Details
- IP Postcode Area - IP10, IP11, IP12, IP13, IP14, IP15, IP16, IP17 Property Market 2017
- IP Postcode Area - IP18, IP19, IP20, IP21, IP22, IP23, IP24, IP25, IP26 Property Market 2017
- IP Postcode Area - IP27, IP28, IP29, IP30, IP31, IP32, IP33 Property Market 2017
All IP Postcodes Yearly & Trend Analysis Posts

Reference
IP Postcode Area As Per Wikipedia
b6b99d3b-1f7e-423b-bc54-6c1e56ae5205|0|.0|27604f05-86ad-47ef-9e05-950bb762570c
Tags :