3. March 2018 14:35
/
VInsights Team
/
/
Comments (0)
Please click here for the updated version of this post
This Post covers
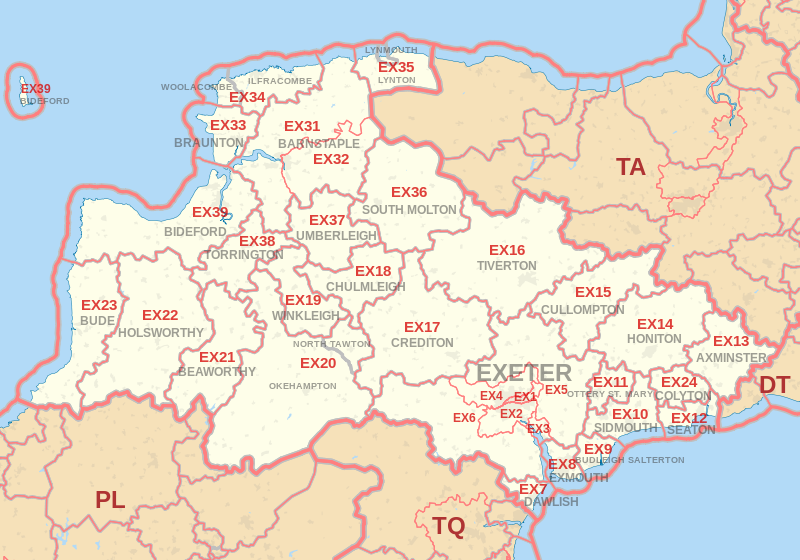 |
| Postcode |
Coverage Area |
Local Authority Area |
| EX10 |
Sidmouth |
East Devon |
| EX11 |
Ottery St. Mary |
East Devon |
| EX12 |
Seaton, Beer, Axmouth, Branscombe |
East Devon |
| EX13 |
Axminster |
East Devon |
| EX14 |
Honiton |
East Devon |
| EX15 |
Cullompton, Plymtree |
Mid Devon |
| EX16 |
Tiverton |
Mid Devon |
| EX17 |
Crediton |
Mid Devon |
| EX18 |
Chulmleigh |
North Devon |
| EX19 |
Winkleigh |
Torridge |
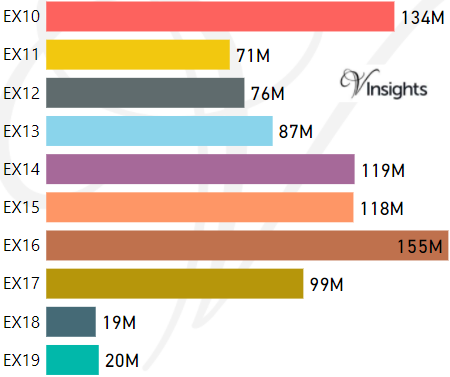
- M represents Million Pounds
- Total value includes Property Type Other apart from Detached, Semi-Detached, Terraced, Flat/Masionette
- EX Postcode Area - EX1, EX2, EX3, EX4, EX5, EX6, EX7, EX8, EX9 School Details
- EX Postcode Area - EX10, EX11, EX12, EX13, EX14, EX15, EX16, EX17, EX18, EX19 School Details
- EX Postcode Area - EX20, EX21, EX22, EX23, EX24 School Details
- EX Postcode Area - EX31, EX32, EX33, EX34, EX35, EX36, EX37, EX38, EX39 School Details
- EX Postcode Area - EX1, EX2, EX3, EX4, EX5, EX6, EX7, EX8, EX9 Property Market 2017
- EX Postcode Area - EX20, EX21, EX22, EX23, EX24 Property Market 2017
- EX Postcode Area - EX31, EX32, EX33, EX34, EX35, EX36, EX37, EX38, EX39 Property Market 2017
All EX Postcodes Yearly & Trend Analysis Posts

Reference
EX Postcode Area As Per Wikipedia
31c53d6a-b2ca-4e71-81d7-0b1b08f2eafa|0|.0|27604f05-86ad-47ef-9e05-950bb762570c
Tags :