Kingston Upon Hull Property Market 2016 at Postcode Level with School Details


Postcode Coverage Area School Local Authority Area
HU1 Hull Details Kingston upon Hull
HU2 Hull Details Kingston upon Hull
HU3 Hull, Spring Bank Details Kingston upon Hull
HU4 Hull, Anlaby Common, Anlaby Park, Gipsyv ille Details Kingston upon Hull
HU5 Hull, The Avenues Details Kingston upon Hull
HU6 Hull, Dunswell, Orchard Park, Greenwood Details Kingston upon Hull
HU7 Hull, Bransholme, Kingswood, Sutton -on-Hull, Wawne Details Kingston upon Hull
HU8 Hull, Garden Village, Ings, Longhil l, Sutton-on-Hull Details Kingston upon Hull
HU9 Hull, Drypool, Victoria Dock, Marfleet, Preston Road, Greatfield, Bilton Grange Details Kingston upon Hull


 All Yorkshire And Humber Posts


Yorkshire and Humber Property Market 2016

Story Highlights

  • Yorkshire and Humber had total property sales of £17 Billions
  • The number of properties sold was 88,650 properties
  • Across counties the maximum sales is in West Yorkshire at £6.95 billions
  • The average property price was £190 K and the median was £145 K
  • The  average sales price at County level is maximum for York at £267 K
  • New properties contributed 8.6% by value and not new property 91.4%
  • Stamp duty hike caused monthly spike in March
  • Brexit coupled with Stamp Duty Hike did not have negative impact on Yorkshire and Humber Property Market in 2016


Yorkshire and Humber is one of the 9 principal areas of England. It comprises of South Yorkshire, West Yorkshire, North Yorkshire, YorkEast Riding of Yorkshire, Kingston upon Hull, North Lincolnshire, North East Lincolnshire.


Total Sales By County
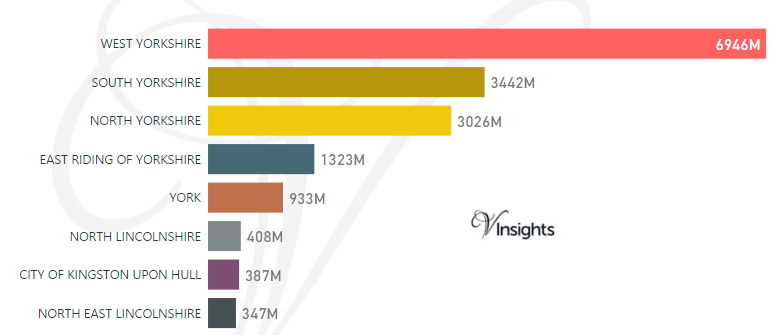
Yorkshire and Humber - Total Sales By County

Yorkshire and Humber had total property sales of £17 Billions. It contributed 5.66% of the England and Wales Property Market 2016.

The total sales of £17 billions in 2016 was split across its counties as above.

Year on Year Comparison : Compared to Yorkshire and Humber Property Market 2015 in 2016

  • Decline in total sales has been in York, City of Kingston Upon Hull


Total Value of Sales By Property Types
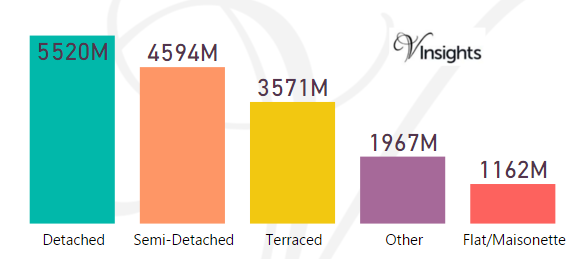
Yorkshire and Humber - Total Value of Sales By Property Types

 The split of £17 billions across the different property types was

  • Detached at £5.52 billions (32.83%)
  • Semi-Detached at £4.59 billions (27.32%)
  • Terraced at £3.57 billions (21.24%)
  • Other at £1.97 billions (11.7%)
  • Flat/Maisonette at £1.16 billions (6.91%)

Year on Year Comparison : Compared to Yorkshire and Humber Property Market 2015 in 2016

  • Only Terraced Property Types had decline
  • Total Sales has shown growth of 6.25%


Month-wise Break-up of Total Sales
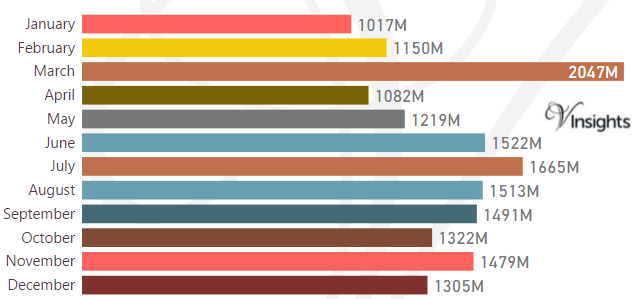
Yorkshire and Humber - Month-wise Break-up of Total Sales

Stamp Duty Hike Impact

  1. March had property sale spike of £2.05 billions compared to £1.15 billions in Feb
  2. The impetus for it was to avoid the extra 3% in Stamp Duty Tax applicable on buying an additional home, being applicable from April 1 2016

Brexit Impact

  1. Brexit took place on 23rd June 2016.
  2. As can be observed from the month-wise break-up there does not seem to have been dip in property sales in the immediate aftermath of Brexit 
  3. Year on Year growth over the last year has been 6.25% so there has been no negative Brexit impact


Total Number of Sales By Property Types
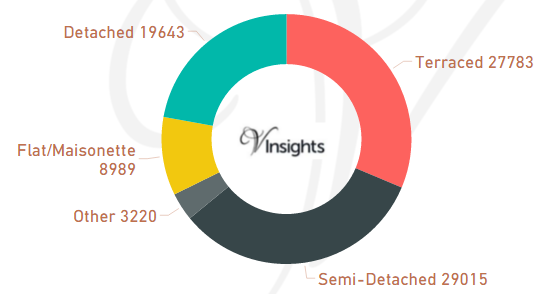
Yorkshire and Humber - Total Number of Sales By Property Types

 The total property sales of £17 Billions in 2016 was spread over 88,650 properties.

  • Terraced properties at 27,783 (31.34%)
  • Semi-Detached at 29,015 (32.73%) 
  • Detached at 19,643 (22.16%)
  • Flat/Maisonette at 8,989 (10.14%)
  • Others at 3,220 (3.63%)

Year on Year Comparison : Compared to Yorkshire and Humber Property Market 2015 in 2016 

  • Total number of property sales in 2016 has decreased by 1.04%
  • All property types have shown decline in number of properties sold except property type Terraced, Other
  • Other has shown significant increase of 123% 


Average & Median Sales Price 
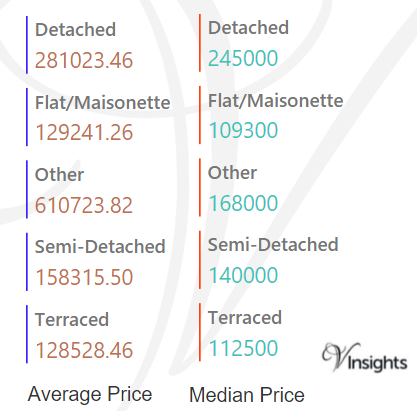
Yorkshire and Humber - Average & Median Sales Price

The average sales price in Yorkshire and Humber was £190 K. For the different property types it was

  • Detached at £281 K
  • Semi-Detached at £158 K
  • Terraced at £129 K
  • Flat/Maisonette at £129 K
  • Other it is at £610 K

The median sales price was £145 K and for different property types it was

  • Detached at £245 K
  • Semi-Detached at £140 K
  • Terraced at £113 K
  • Flat/Maisonette at £109 K
  • Other at £168 K

Year on Year Comparison : Compared to Yorkshire and Humber Property Market 2015 in 2016 

  • The average and median property prices have gone up except for property type Other


Average & Median Sales Price By County
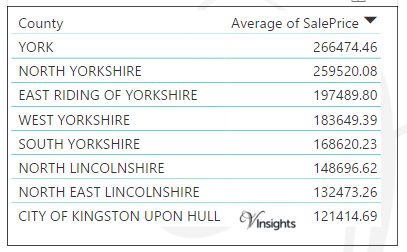
Yorkshire and Humber - Average Sales Price By County

The average sales price by county in Yorkshire and Humber 2016 is as above.
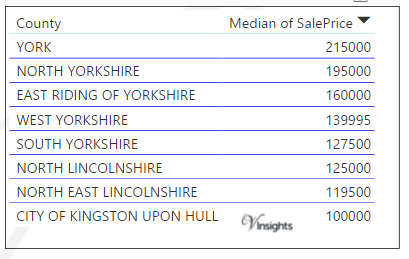
Yorkshire and Humber - Median Sales Price By County

The median sales price by county in Yorkshire and Humber 2016 is as above.

 Year on Year Comparison : Compared to Yorkshire and Humber Property Market 2015 in 2016 

  • Broadly the sale price across the counties has gone up


New Vs Not New Property Statistics
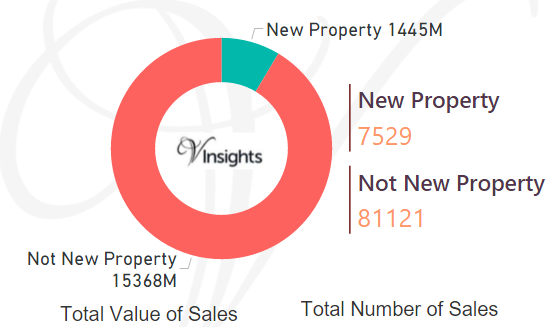
Yorkshire and Humber - New Vs Not New Property Statistics

By Value of Sales

  • The sales value contributed by New Property was £1.45 billions (8.6%)
  • where as Not New Property contributed £15.4 billions (91.4%)

By Number of Sales

  • New properties sold were 7,529 (8.49%)
  • where as not new property sold were 81,121(91.51%)

Year on Year Comparison : Compared to Yorkshire and Humber Property Market 2015 in 2016 

  • New property market share in property market has gone down in 2016 over 2015


All England Posts


York Property Market 2015

Story Highlights

  • York had total Property Sales of £976 millions in 2015
  • The total number of properties sold in year 2015 was 3,711
  • The Average property price was £263 K, while Median was £212 K
  • Not New Property contributed 93.14% by value and New Property 6.86% by value


York has unitary authority status in Yorkshire and Humber.


Total Sales By Property Type

York - Total Sales By Property Type

York had total property sales of £976 million, which was 6.03% of the Yorkshire and Humber Property Market 2015.

The split across the different property types was:

  • Terraced at £266 millions (27.26%)
  • Detached at £264 millions (27.08%)
  • Semi-Detached at £ 242 millions (24.85%)
  • Flat/Maisonette at £106 millions (10.83%)
  • Other at £97 millions (9.98%)


Total No Of Properties Sold By Property Type

York - Total No Of Properties Sold By Property Type

 The total property sales of £976 millions in 2015 was spread over 3,711 properties.

  • Terraced properties at 1190 (32.07%)
  • Semi-Detached at 1084 (29.21%) 
  • Detached at 785 (21.15%)
  • Flat/Maisonette at 597 (16.09%)
  • Others at 55 (1.48%)


Average & Median Sales Price

York - Average & Median Sales Price


The average sales price in York was £263 K. For the different property types it was

  • Detached at £337 K
  • Semi-Detached at £224 K
  • Terraced at £224 K
  • Flat/Maisonette at £177 K
  • Other it is at £1.8 millions


The median sales price was £212 K and for different property types it was

  • Detached at £310 K
  • Semi-Detached at £206 K
  • Terraced at £187 K
  • Flat/Maisonette at £150 K
  • Other at £363 K


New Vs Not New Property Statistics

York - New Vs Not New Property Statistics

By Value Of Sales

  • New Property contributed £67 millions  (6.86%)
  • Not New Property £909 millions (93.14%)

By Number Of Sales

  • The number of New Property sold was 260 (7.01%)
  • The number of Not New Properties sold was 3451 (92.99%)


All Yorkshire And Humber Posts 

West Yorkshire Property Market 2015

 Story Highlights

  • West Yorkshire had total property sales of £6.5 billions in 2015.
  • The total number of properties sold in 2015 in West Yorkshire was 36,386
  • The total volume of sales at district level was maximum for Leeds at £2.9 billions
  • The average sales price in West Yorkshire was £179 K, whereas median was £135 K
  • The average sales price at district level was maximum for Leeds at £216 K
  • New Property sales in West Yorkshire was 11.28% and Not New Property was 88.72%


West Yorkshire is one of the counties of Yorkshire and Humber. The districts in West Yorkshire are Leeds, Bradford, Kirklees, Wakefield, Calderdale.


Total Sales By Districts

West Yorkshire - Total Sales By Districts

West Yorkshire had total property sales of £6.5 billions which was 40.2% of the Yorkshire and Humber Property Market 2015. 

 The split across its districts is as follow:

  • Leeds at £2.9 billions (44.02%)
  • Bradford at £1.2 billions (18.39%)
  • Kirklees at £989 millions (15.21%)
  • Wakefield at £906 millions (13.93%)
  • Calderdale at £550 millions (8.45%)


Total Sales By Property Type

West Yorkshire - Total Sales By Property Type

The split of £6.5 billions across the different property types in West Yorkshire are :

  • Detached at £1.91 billions (29.37%)
  • Semi-Detached at £1.84 billions (28.3%)   
  • Terraced at £1.6 billions (24.38%)
  • Flat/Maisonette at £462 millions (7.1%) 
  • Other at £706 millions (10.85%)


Total No Of Properties Sold By Property Type

West Yorkshire - Total No Of Properties Sold By Property Type


The total property sales of £6.5 billions in 2015 was spread over 36,386 properties.

  • Detached at 6678 (18.35%)
  • Semi-Detached at 11953 (32.85%)
  • Terraced properties at 13139 (36.11%)
  • Flat/Maisonette at 4045 (11.12%)
  • Others at 571 (1.57%)


Average & Median Sales Price

West Yorkshire - Average & Median Sales Price


The average sales price in West Yorkshire was £179 K. For the different property types it was:

  • Detached at £286 K
  • Semi-Detached at £154 K
  • Terraced at £120 K
  • Flat/Maisonette at £114 K
  • Other at £1.23 millions

Similarly median sales price in West Yorkshire was £135 K. For the different property types it was:

  • Detached at £250 K
  • Semi-Detached at £140 K
  • Terraced at £108 K
  • Flat/Maisonette at £100 K
  • Other at £305 K


Average & Median Sales Price By Districts

West Yorkshire - Average Sales Price By Districts

 The average sales prices at district level in West Yorkshire for 2015 is as follows:

  • Leeds at £216 K
  • Kirklees at £160 K
  • Bradford at £158 K
  • Wakefield at £156 K
  • Calderdale at £154 K

West Yorkshire - Median Sales Price By Districts

 The median sales prices at district level in West Yorkshire for 2015 is as follows:

  • Leeds at £152 K
  • Kirklees at £132 K
  • Calderdale at £125 K
  • Wakefield at £125 K
  • Bradford at £125 K


New Vs Not New Property Statistics

west Yorkshire - New Vs Not New Property Statistics

By Value of Sales

  • The sales value contributed by Not New Property was £5.77 billions (88.72%)
  • where as  New Property contributed £734 millions (11.28%)


By Number of Sales

  • New properties sold were 3784 (10.4%)
  • where as not new property sold were 32,602 (89.6%)


All West Yorkshire Posts


South Yorkshire Property Market 2015

Story Highlights

  • South Yorkshire had total property sales of £3.41 billions in 2015
  • The total number of properties sold in 2015 in South Yorkshire  was 20,083
  • The total volume of sales at district level was maximum for Sheffield at £1.6 billions
  • The average sales price in South Yorkshire was £170 K, whereas median was £125 K
  • The average sales price at district level was maximum for Sheffield at £199 K
  • New Property sales in South Yorkshire was 10.18% and Not New Property was 89.82%


South Yorkshire is one of the counties of Yorkshire and Humber. The districts in South Yorkshire are Sheffield, Doncaster, Rotherham, Barnsley.


Total Sales By Districts

South Yorkshire - Total Sales By Districts


South Yorkshire had total property sales of £3.41 billions which was 21.07% of the Yorkshire and Humber Property Market 2015.

The split across its districts is as follow:

  • Sheffield £1.6 billions (47.56%)
  • Doncaster £757 millions (22.19%)
  • Rotherham £553 millions (16.22%)
  • Barnsley £478 millions (14.02%)


Total Sales By Property Type

South Yorkshire - Total Sales By Property Type


The split of £3.41 billions across the different property types in South Yorkshire are :

  • Detached at £1.03 billions (30.29%)
  • Semi-Detached at £1 billions (29.46%)   
  • Terraced at £666 millions (19.54%)
  • Other at £511 millions (14.98%)
  • Flat/Maisonette at £196 millions (5.74%) 


Total No Of Properties Sold By Property Type

South Yorkshire - Total No Of Properties Sold By Property Type


 The total property sales of £3.41 billions in 2015 was spread over 20,083 properties. 

  • Detached 4325 (21.54%)
  • Semi-Detached 7500 (37.35%)
  • Terraced 6172 (30.73%)
  • Flat/Maisonette 1748 (8.7%)
  • Others 338 (1.68%)


Average & Median Sales Price

South Yorkshire - Average & Median Sales Price

The average sales price in South Yorkshire was £170 K. For the different property types it was:

  • Detached at £239 K
  • Semi-Detached at £134 K
  • Terraced at £108 K
  • Flat/Maisonette at £112 K
  • Other at £1.5 millions

Similarly median sales price in South Yorkshire was £125 K. For the different property types it was:

  • Detached at £210 K
  • Semi-Detached at £120 K
  • Terraced at £94 K
  • Flat/Maisonette at £100 K
  • Other at £300 K


Average & Median Sales Price By Districts

South Yorkshire - Average Sales Price By Districts

 The average sales prices at district level in South Yorkshire for 2015 is as follows:

  • Sheffield at £199 K
  • Doncaster at £164 K
  • Rotherham at £149 K
  • Barnsley at £133 K

South Yorkshire - Median Sales Price By Districts

 The median sales prices at district level in South Yorkshire for 2015 is as follows:

  • Sheffield at £135 K
  • Rotherham at £127 K
  • Doncaster at £120 K
  • Barnsley at £110 K


New Vs Not New Property Statistics

South Yorkshire - New Vs Not New Property Statistics

By Value of Sales

  • The sales value contributed by Not New Property was £3.06 billions (89.82%)
  • where as  New Property contributed £347 millions (10.18%)


By Number of Sales

  • New properties sold were 2021 (10.06%)
  • where as not new property sold were 18,062 (89.94%)


All South Yorkshire Posts