Story Highlights
- Wales had total property sales of £8.37 Billions in Wales 2015, the regional distribution shows that South Wales is the clear leader with £5.285 billions (63.15%) worth of sales.
- Out of Total Number of Property sold (47170) in Wales 2015, South Wales had the maximum number of property transactions 29417 (62.36%).
- The Average Sales Price in 2015 by region are: West Wales £166 k , South Wales £180 k, North Wales £172 k, Mid Wales £192 k.
- The Median Sales Price in 2015 by region are: West Wales £140 k, South Wales £138 k, North Wales £145 k, Mid Wales £165 k.
- South Wales had maximum Detached Property Sales totaling £1679 millions in 2015 spread over 6517 properties.
- South Wales had maximum Semi-Detached Property Sales totaling £1232 millions in 2015 spread over 8113 properties.
- South Wales had maximum Terraced Property Sales totaling £1366 millions in 2015 spread over 11453 properties
Wales can be broadly divided into four regions: North Wales, Mid Wales, West Wales, South Wales. It has a varied and contrasting topography. In the south & west are the flat coastal plains, beaches giving way to valleys, then to ranges of hills and mountains in mid and north wales.
The principal areas North Wales has are Conwy, Denbighshire, Flintshire, Gwynedd, Isle of Anglesey, Wrexham. Mid Wales has Ceredigion, Powys. West Wales has Carmarthenshire, Pembrokeshire while South Wales has Blaenau Gwent, Bridgend, Caerphilly, Cardiff, Merthyr Tydfil, Monmouthshire, Newport, Torfaen, Vale of Glamorgan, Rhondda Cynon Taff.
Total Value & Number Of Sales By Region
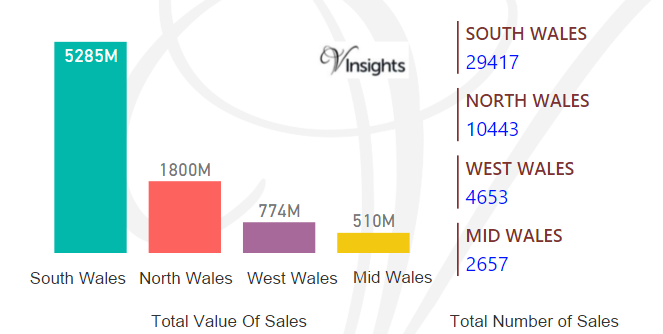
Out of the total property sales of £8.37 Billions in Wales 2015 the regional distribution shows that South Wales is the clear leader with £5.285 billions (63.15%) worth of sales
Out of Total Number of Property sold (47170) in Wales 2015
Let us look at the different property by regions:
Detached Total Value & Number Of Sales By Region
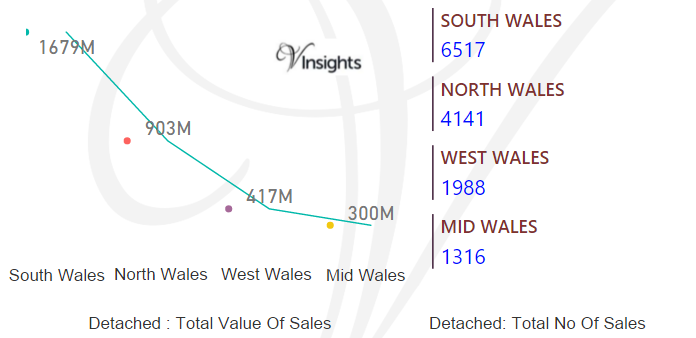
- South Wales had maximum Detached Property Sales totaling £1679 millions in 2015 spread over 6517 properties
- North Wales had sales of £903 millions over 4141 properties
- West Wales had Property Sales of £417 millions over 1988 properties
- Mid Wales had £300 millions with total number of properties sold 1316.
Semi-Detached Total Value & Number Of Sales By Region
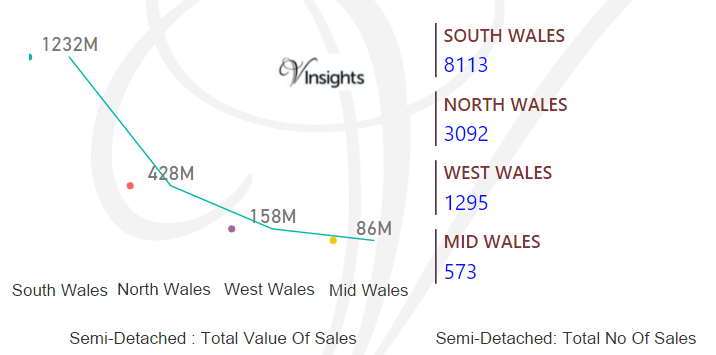
- South Wales had maximum Semi-Detached Property Sales totaling £1232 millions in 2015 spread over 8113 properties
- North Wales had sales of £428 millions over 3092 properties
- West Wales had Property Sales of £158 millions over 1295 properties
- Mid Wales had £86 millions with total number of properties sold 573.
Terraced Total Value & Number of Sales By Region
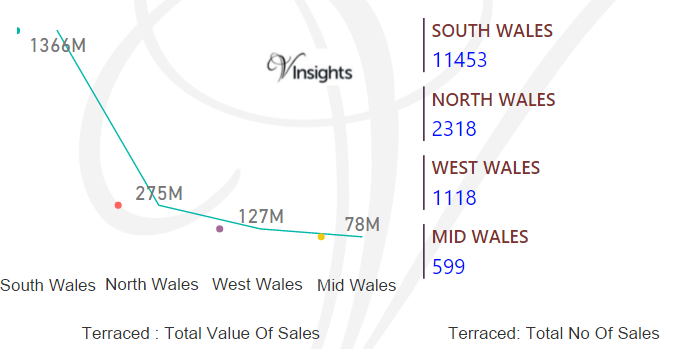
- South Wales had maximum Terraced Property Sales totaling £1366 millions in 2015 spread over 11453 properties
- North Wales had sales of £275 millions over 2318 properties
- West Wales had Property Sales of £127 millions over 1118 properties
- Mid Wales had £78 millions with total number of properties sold 599.
Flat/Maisonette Total Value & Number Of Sales By Region
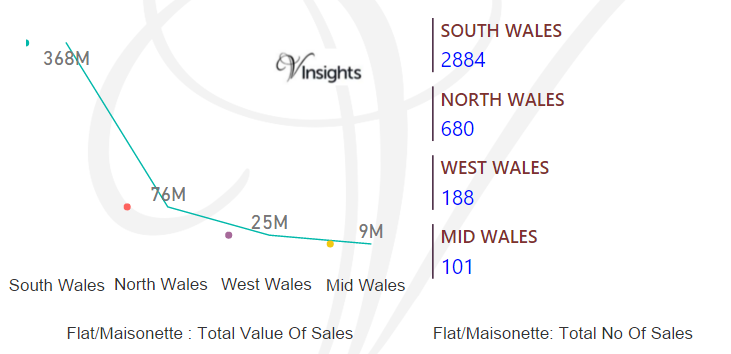
- South Wales had maximum Flat/Maisonette Property Sales totaling £368 millions in 2015 spread over 2884 properties
- North Wales had sales of £76 millions over 680 properties
- West Wales had Property Sales of £25 millions over 188 properties
- Mid Wales had £9 millions with total number of properties sold 101.
Other Total Sales & Number Of Sales By Region
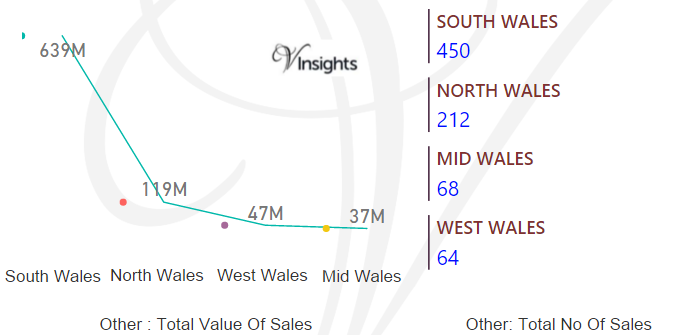
- South Wales had maximum Other Property Sales totaling £639 millions in 2015 spread over 450 properties
- North Wales had sales of £119 millions over 212 properties
- West Wales had Property Sales of £47 millions over 68 properties
- Mid Wales had £37 millions with total number of properties sold 64.
Average & Median Value of Property By Region
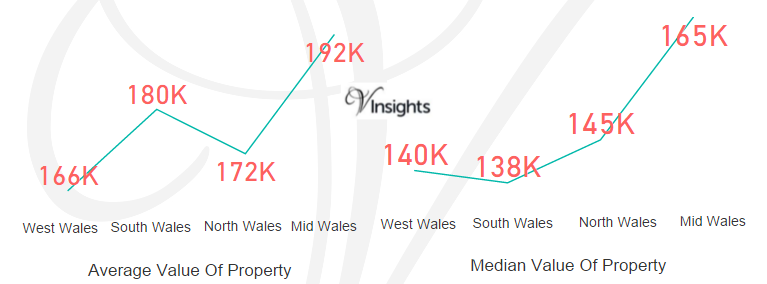
The Average Sales Price in 2015 by region are:
The Median Sales Price in 2015 by region are:
The median probably gives a better representation of the property prices as it helps to temper the effects of outliers in the sales price.
In next post we will cover the principal areas in each of the region and gain further insights about Wales Property Market.
All Wales Post

690ae358-a161-4737-8d6b-72fe243c5ed9|0|.0|27604f05-86ad-47ef-9e05-950bb762570c