For 2016 details - West Midlands Property Market 2016
Story Highlights
- West Midlands had total property sales of £19 Billions in 2015
- The number of properties sold was 88,925 properties
- The average property price was £209 K and the median was £160 K
- The sales price at the county level was maximum at Warwickshire £262 K
- New properties contributed 11.34% by sales value and not new 88.66%
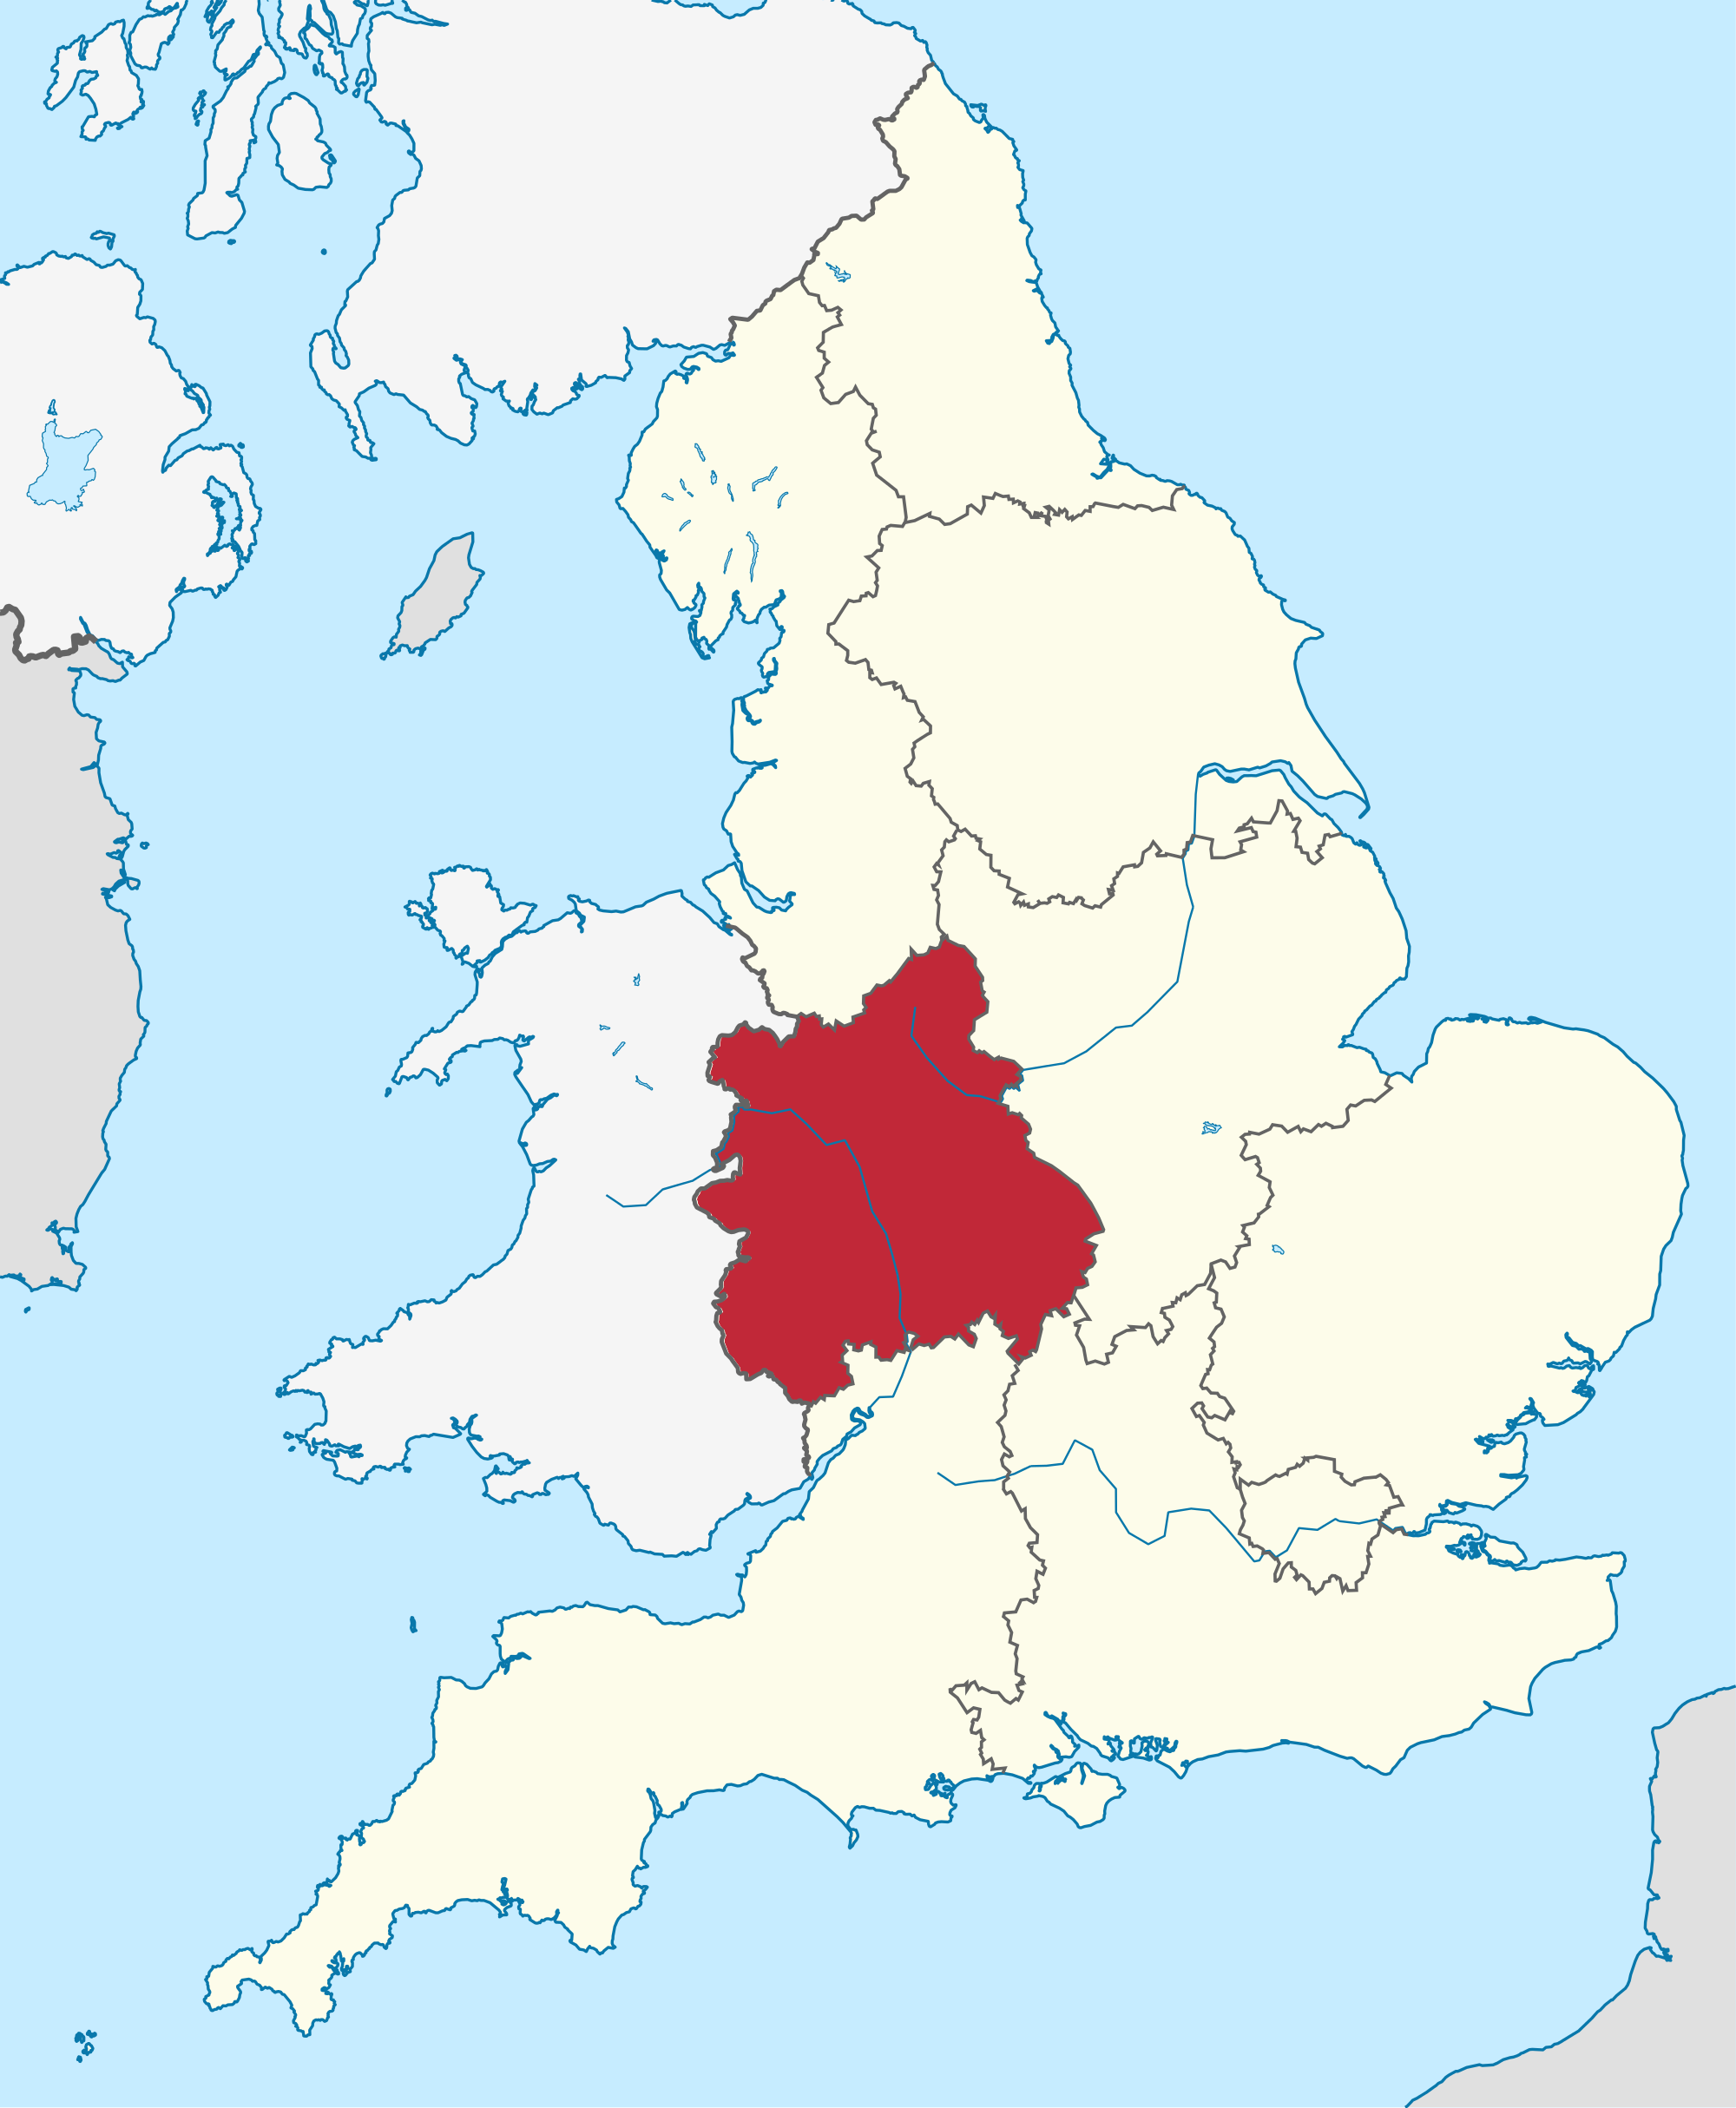
West Midlands is one of the 9 principal areas of England. It comprises of Herefordshire, Shropshire, Telford and Wrekin, Staffordshire, Stoke-on-Trent,Warwickshire, West Midlands county , Worcestershire.
Total Value of Sales By Property Types
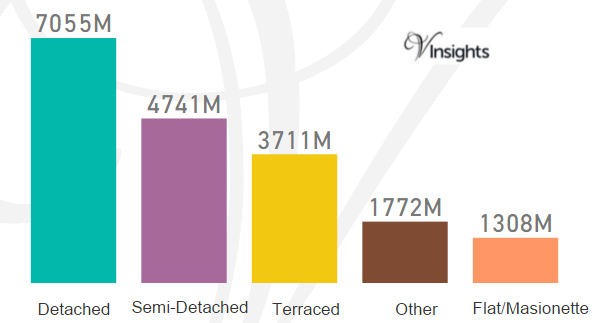
West Midlands had total property sales of £19 billions. It contributed 6.3% of the England and Wales Property Market 2015.
The split across the different property types was
- Detached at £7.06 billions (37.16%)
- Semi-Detached at £4.74 billions (24.95%)
- Terraced at £3.71 billions (19.5 %)
- Other at £1.77 billions (9.31%)
- Flat/Maisonette at £1.31 Billions (6.9%)
Total Sales By County
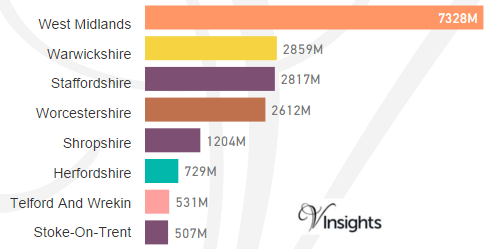
The total sales of £19 billions in 2015 was split across its counties as above.
Total Number of Sales By Property Types
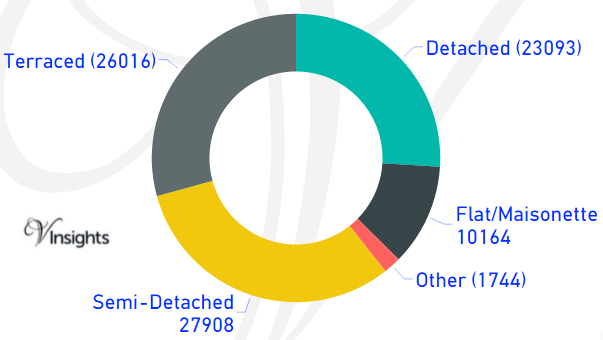
The total property sales of £19 billions in 2015 was spread over 88,925 properties.
- Semi-Detached at 27,908 (31.38%)
- Terraced at 26,016 (29.26%)
- Detached at 23,093 (25.97%)
- Flat/Maisonette at 10,164 (11.43%)
- Others at 1,744 (1.96%)
Average & Median Sales Price
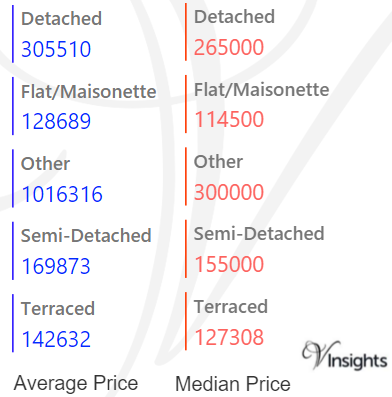
The average sales price in West Midlands was £209 K. For the different property types it was
- Detached £306 K
- Semi-Detached £170 K
- Terraced £143 K
- Flat/Maisonette £129 K
- Other it is £1.02 million.
The median sales price in West Midlands was £160 K. For the different property types it was
- Detached £265 at K
- Semi-Detached at £155 K
- Terraced at £127 K
- Flat/Maisonette at £115 K
- Other it is at £300 K
Average & Median Sales Price By County
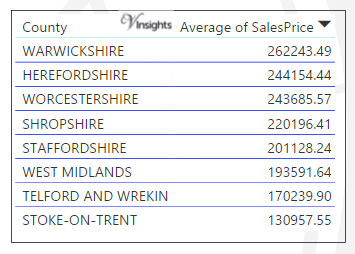
The average sales price at the county level in West Midlands 2015 is as above.
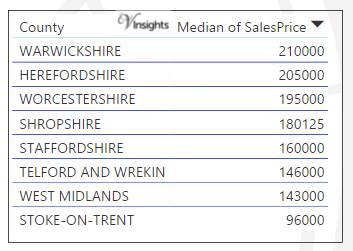
The median sales price at the county level in West Midlands 2015 is as above.
New Vs Not New Property Statistics
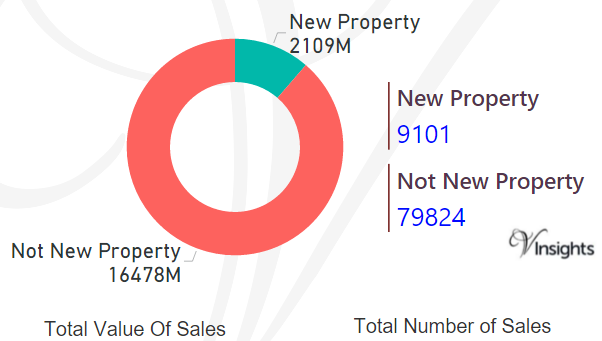
By Value Of Sales
- The sales value contributed by New Property was £2.11 billions (11.34%)
- where as Not New Property contributed £16.5 billions (88.66 %).
By Number Of sales
- New properties sold were 9,101 (10.23%)
- where as not new property sold were 79,824 (89.77%).
All England Posts

9de170f4-ff7d-4850-a485-872ca4b0247a|0|.0|27604f05-86ad-47ef-9e05-950bb762570c