13. October 2016 18:35
/
VInsights Team
/
Wales
/
Comments (0)
Story Highlights
- Monmouthshire in 2015 had total property sales of about £462 millions.
- The total number of property sold was 1543.
- The average price was maximum for Detached £315 K, while median was £279 K (excluding others).
- New Property Sales Values was about £34 millions (7.28%) & Not New Property Sales Value was £428 millions (92.72%)
- The number of new property sold was 111 (7.19%) & Number of Not New Property Sales was 1432 (92.81%).
Total Sales Value By Property Types
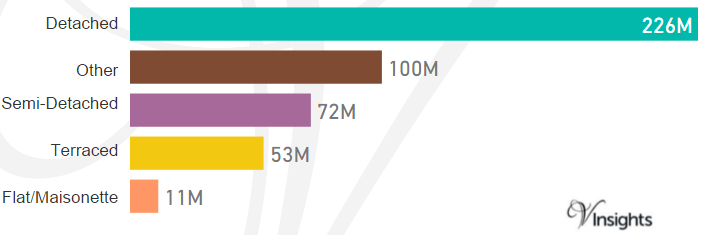
Monmouthshire in 2015 had total property sales of about £462 millions. When split over different property types it is:
- Detached £226 millions (48.81%)
- Other £100 millions (21.66%)
- Semi-Detached £72 millions (15,56%)
- Terraced £53 millions (11.5%)
- Flat/Maisonette £11 millions (2.46%)
Total No Of Properties Sold By Property Type
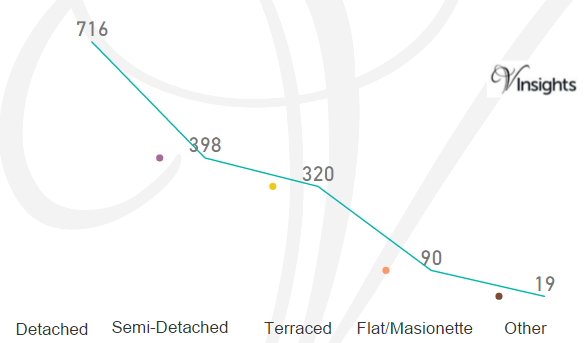
In 2015 the total number of properties sold in Monmouthshire was 1543. The market share for the different property type are:
- Detached 716 (46.4%)
- Semi-Detached 398 (25.79%)
- Terraced 320 (20.74%)
- Flat/Maisonette 90 (5.83%)
- Other 19 (1.23%)
Average & Median Sales Price
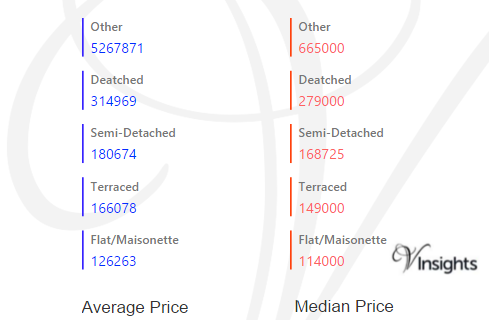
The average price for different type of properties sold in Monmouthshire 2015 are:
- Other £527 K
- Detached £315 K
- Semi-Detached £181 K
- Terraced £166 K
- Flat/Maisonette £126 k
The median price for different type of properties sold in Monmouthshire 2015 are:
- Other £665 k
- Detached £279 K
- Semi-Detached £169 K
- Terraced £149 K
- Flat/Maisonette £114 k
New Vs Not New Property Statistics
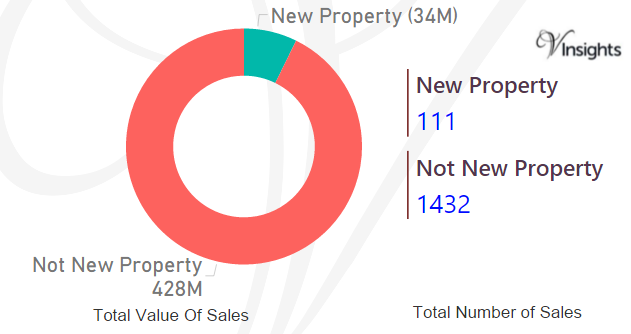
By Value Of Sales
- New Property Sales Values was about £34 millions (7.28%)
- Not New Property Sales Value was £428 millions (92.72%) giving total of £462 millions.
By Number Of Sales
- New property sold was 111 (7.19%)
- Number of Not New Property Sales was 1432 (92.81%) giving total of 1543.
All Posts on South Wales

a7109701-ed37-4c30-8288-e8d101fcfa29|0|.0|27604f05-86ad-47ef-9e05-950bb762570c