Story Highlights
- Tunbridge Wells had total property sales of £941 millions in 2016
- The total number of properties sold in 2016 was 2098
- The average sales price in Tunbridge Wells was £448 K, whereas the median was £327 K
- New Property sales were 5.27% by value, whereas Not New Property contributed 94.73%.
- Stamp duty changes caused monthly spike in March
- Brexit coupled with Stamp Duty changes have negative impact, there was decline of 2.0%
Tunbridge Wells is one of the districts of Kent
Total Sales By Property Type
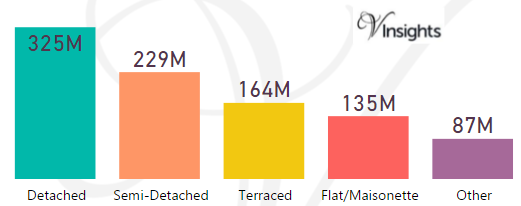
Tunbridge Wells had total property sales of £941 millions which was 10.09% of the total Kent Property Market 2016
The split of £941 millions across the different property types are:
- Detached £325 millions (34.6%)
- Semi-Detached £229 millions (24.39%)
- Terraced £164 millions (17.4%)
- Flat/Maisonette £135 millions (14.38%)
- Other £87 millions (9.22%)
Tunbridge Wells Property Market at Postcode Level
| Postcode |
Coverage Area |
School |
Local Authority Area |
| TN1 |
Royal Tunbridge Wells(town centre) |
Details |
Tunbridge Wells |
| TN2 |
Royal Tunbridge Wells,Pembury |
Details |
Tunbridge Wells |
| TN3 |
Langton Green,Groombridge,Frant,Speldhurst,Lamberh urst |
Details |
Tunbridge Wells, Wealden |
| TN4 |
Royal Tunbridge Wells, Rusthall,Southborough |
Details |
Tunbridge Wells |
| TN11 |
Penshurst,Hildenborough,Hadlow |
Details |
Sevenoaks, Tonbridge and Malling, Tunbridge Wells |
| TN12 |
Paddock Wood,Staplehurst,Brenchley,Horsmonden,Mard en,East Peckham |
Details |
Maidstone, Tonbridge and Malling, Tunbridge Wells |
| TN17 |
Cranbrook,Goudhurst,Benenden,Frittenden |
Details |
Ashford, Tunbridge Wells |
| TN18 |
Hawkhurst,Sandhurst |
Details |
Tunbridge Wells |
Month-wise Break-up of Total Sales
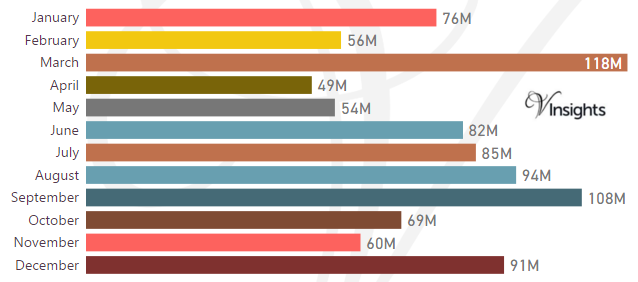
Some of the insights based on the £941 millions month-wise break-down :
Stamp Duty Hike Impact
- March had property sale spike of £118 millions compared to £56 millions in Feb and then sales sharply drop
- The impetus for it was to avoid the extra 3% in Stamp Duty Tax applicable on buying an additional home, being applicable from April 1 2016
Brexit Impact
- Brexit took place on 23rd June 2016.
- Year on Year decline has been 2.0% in 2016 over 2015
- Brexit coupled with Stamp Duty Hike had negative impact on Tunbridge Wells Property Market in 2016
Total No Of Properties Sold By Property Type
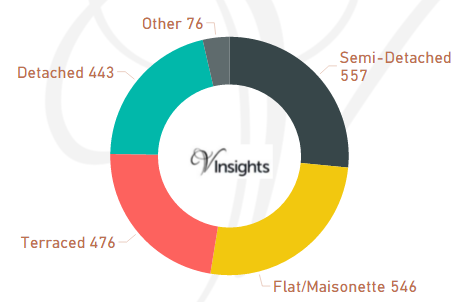
Tunbridge Wells had total property sales of 2098. The split across the different property types are:
- Semi-Detached 557 (26.55%)
- Flat/Maisonette 546 (26.02%)
- Terraced 476 (22.69%)
- Detached 443 (21.12%)
- Other 76 (3.62%)
Average & Median Sales Price
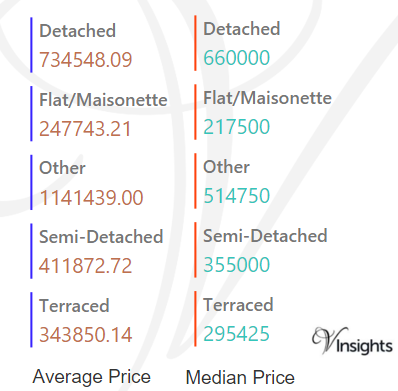
The average sales price in Tunbridge Wells was £448 K and for different property types it was:
- Detached £735 K
- Semi-Detached £412 K
- Terraced £344 K
- Flat/Maisonette £248 K
- Other it is £1.14 millions
Similarly median sales price in Tunbridge Wells was £327 K and for different property types are:
- Detached £660 K
- Semi-Detached £355 K
- Terraced £295 K
- Flat/Maisonette £218 K
- Other it is £515 K
New Vs Not New Property Statistics
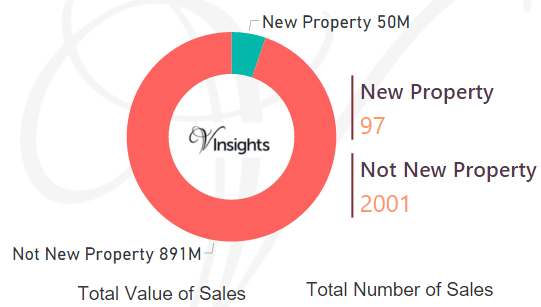
By Sales Value the split is as follows:
- New Property contributed £50 millions (5.27%)
- Not New Property contributed £891 millions (94.73%)
By Total Number the split is as follows:
- New properties sold were 97 (4.62%)
- Not new property sold were 2,001 (95.38%)
All Kent Posts

5ada9638-e4db-438f-84c0-61ade4ced914|0|.0|27604f05-86ad-47ef-9e05-950bb762570c