Story Highlights
- Kensington And Chelsea in 2016 had total property sales of £4.64 billions
- The total number of property sold in Kensington And Chelsea 2016 was 2,196
- The average sales price in Kensington And Chelsea was £2.11 millions and the median sales price was £1.21 millions
- The sales value contributed by New Property was 10.26% where as Not New Property contributed 89.74%
- Stamp duty changes caused monthly spike in March
- Brexit coupled with Stamp duty changes caused significant decline in property sales, declines by 21%
Total Sales By Property Type
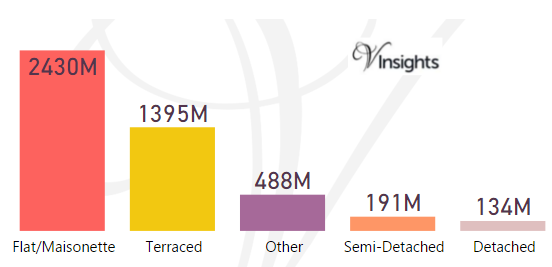
Kensington And Chelsea is one of the Boroughs of Central London. It had total Property Sales of £4.64 billions which was 18.79% of Central London Property Market 2016.
The split across the different property types are:
- Terraced £1.4 billions (30.08%)
- Semi-Detached £191 millions (4.13%)
- Other £488 millions (10.51%)
- Flat/Maisonette £2.43 billions (52.4%)
- Detached £134 millions (2.88%)
Year on Year Comparison : Compared to Kensignton And Chelsea London Property Market 2015 in 2016
- All the property type except Detached had lower total sales compared to 2015
- Detached property had higher sales of £31 millions i.e. 30 %
Kensignton And Chelsea Property Market at Postcode level
| Postcode |
Coverage Area
|
Local Authority Area |
| SW1W |
Belgravia, Chelsea (part), area between Sloane Square and Victoria Station, south of Kings Road
|
Kensington and Chelsea, Westminster |
| SW1X |
Belgravia, north of Eaton Square, Knightsbridge (part), Chelsea (part) |
Kensington and Chelsea, Westminster |
| SW3 |
Chelsea, Brompton, Knightsbridge (part) |
Kensington and Chelsea |
| SW5 |
Earls Court |
Kensington and Chelsea |
| SW7 |
South Kensington, Knightsbridge (part) |
Kensington and Chelsea, Westminster |
| W2 |
Paddington, Bayswater, Hyde Park, Westbourne Green, Little Venice (part), Notting Hill (part) |
Westminster, Kensington and Chelsea |
| W8 |
Kensington, Holland Park (part) |
Kensington and Chelsea |
| W10 |
North Kensington, Kensal Town, Ladbroke Grove (north), Queen's Park (part) |
Kensington and Chelsea, Westminster, Hammersmith and Fulham, Brent |
| W11 |
Notting Hill, Ladbroke Grove (south), Holland Park (part) |
Kensington and Chelsea, Westminster, Hammersmith and Fulham |
| W14 |
West Kensington, Kensington Olympia, Holland Park
|
Hammersmith and Fulham, Kensington and Chelsea |
Month-wise break-up of Total Sales
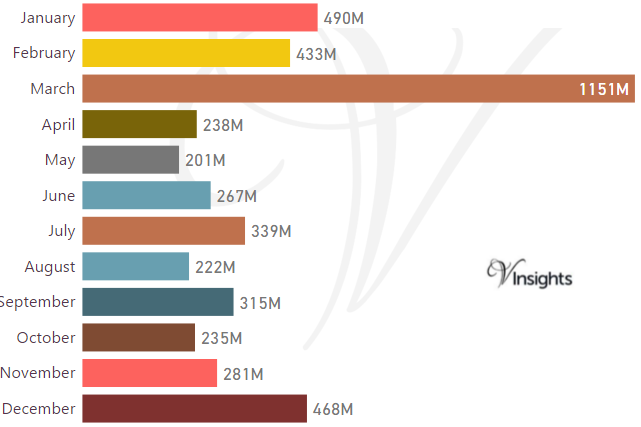
Some of the insights based on the £4.64 billions month-wise break-down :
Stamp Duty Hike Impact
- March had property sale spike of £1.15 billions compared to £433 millions in Feb
- The impetus for it was to avoid the extra 3% in Stamp Duty Tax applicable on buying an additional home, being applicable from April 1 2016
Brexit Impact
- Brexit took place on 23rd June 2016.
- As can be observed from the month-wise break-up there seems to have been dip in property sales in the immediate after-math of Brexit
- Year on Year the property market for Kensington And Chelsea has shown a decline of 21.36% over 2015
Total No Of Properties Sold By Property Type
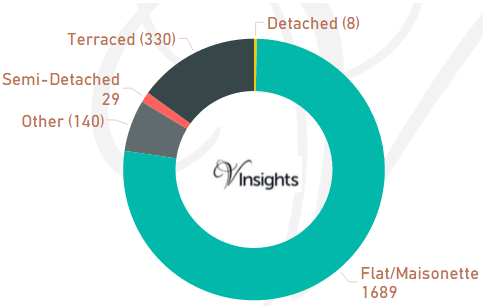
In Kensignton and Chelsea the total number of properties sold in the year 2016 was 2196. The breakdown by different property types are:
- Terraced 330(15.03%)
- Semi-Detached 29 (1.32%)
- Other 140 (6.38%)
- Flat/Maisonette 1,689 (76.91%)
- Detached 8 (0.36%)
Year on Year Comparison : Compared to Kensignton And Chelsea London Property Market 2015 in 2016
- Total sales volume has declined by 486 i.e. 18.12 %
- All the property type had lower sales volume compared to 2015
Average & Median Sales Price
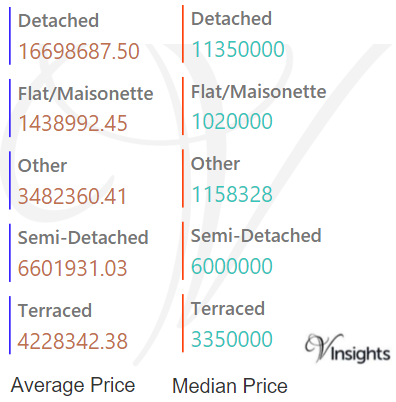
In 2015 the Average property price was £2.11 millions in Kensington and Chlesea. The average property price for the different property types are:
- Detached £16.7 millions
- Flat/Maisonette £1.44 millions
- Other £3.5 millions
- Semi-Detached £6.6 millions
- Terraced £4.23 millions
The Median Price was £1.21 millions. The median property price for the different property types are:
- Detached £11.35 millions
- Flat/Maisonette £1.02 millions
- Other £1.16 millions
- Semi-Detached £6 millions
- Terraced £3.35 millions
Year on Year Comparison : Compared to Kensignton And Chelsea London Property Market 2015 in 2016
- Detached, Terraced had increase in average property price
- Flat/Maisonette, Other, Semi-Detached had decrease in average property price
New Vs Not New Property Statistics
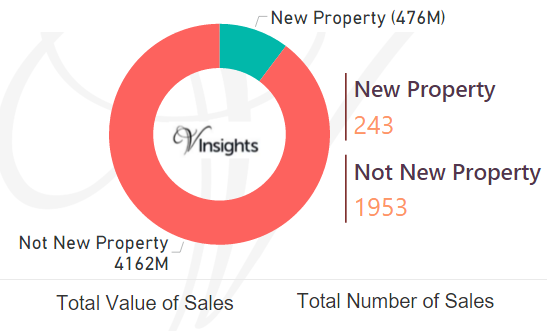
By Value Of Sales
- Not New Property contributed £4.16 billion (89.74%)
- New Property £476 millions (10.26%)
By Number Of Sales
- The number of Not New Property sold was 1953 (88.93%)
- The number of New Properties sold was 243 (11.07%)
Year on Year Comparison : Compared to Kensignton And Chelsea London Property Market 2015 in 2016
- New property market share in property market has gone down in 2016 over 2015
All London Posts
49455acc-6be0-44a8-a7b9-28450337aeca|0|.0|27604f05-86ad-47ef-9e05-950bb762570c