Story Highlights
- Elmbridge had total property sales of £1.8 billions in 2016
- The total number of properties sold in 2016 was 2,407
- The average sales price was £764 K, whereas the median was £525 K
- New Property sales were 2.53% by value, whereas Not New Property contributed 97.47%
- Stamp duty changes caused monthly spike in March
- Brexit coupled with Stamp Duty changes had negative impact, causing decline of 4.7 over 2015
Elmbridge is one of the districts of Surrey.
Total Sales By Property Type
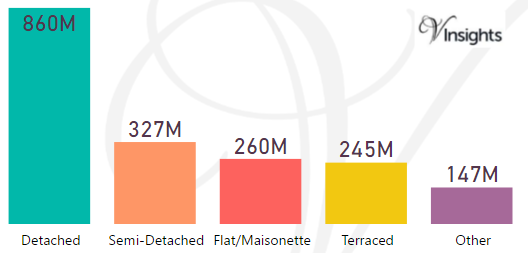
Elmbridge had total property sales of £1.8 billions which was 17.14% of the total Surrey Property Market 2016
The split of £1.8 billions across the different property types are:
- Detached £860 millions (46.75%)
- Semi-Detached £327 millions (17.79%)
- Flat/Maisonette £260 millions (14.15%)
- Terraced £245 millions (13.34%)
- Other £147 millions (7.98%)
Elmbridge Property Market at Postcode Level
| Postcode |
Coverage Area |
School |
Local Authority Area |
| KT6 |
Surbiton, Tolworth, Long Ditton |
Details |
Kingston Upon Thames, Elmbridge |
| KT7 |
Thames Ditton, Weston Green |
Details |
Elmbridge |
| KT8 |
East Molesey, West Molesey, Hampton Court Palace and part of its Park; 1.5 Thames islands, part of Bushy Park, Hampton Court neighbourhood, Hampton |
Details |
Elmbridge, Richmond upon Thames |
| KT9 |
Chessington including Malden Rushett, Hook, part of Long Ditton |
Details |
Kingston Upon Thames, Elmbridge |
| KT10 |
Esher, Claygate, Hinchley Wood |
Details |
Elmbridge |
| KT11 |
Cobham, Stoke d'Abernon, Downside, Hatchford, parts of Wisley, Ockham and Hersham |
Details |
Elmbridge, Mole Valley |
| KT12 |
Walton-on-Thames, Hersham, Whiteley Village |
Details |
Elmbridge |
| KT13 |
Weybridge, Oatlands, Saint George's Hill, Hamm Court |
Details |
Elmbridge, Runnymede |
| KT14 |
Byfleet, West Byfleet |
Details |
Woking, Elmbridge, Runnymede |
| KT22 |
Leatherhead, Oxshott, Fetcham |
Details |
Mole Valley, Elmbridge |
| TW16 |
Sunbury-on-Thames |
Details |
Elmbridge, Richmond upon Thames, Spelthorne |
| TW17 |
Shepperton, Upper Halliford, Charlton, Littleton |
Details |
Elmbridge, Spelthorne |
Month-wise Break-up of Total Sales
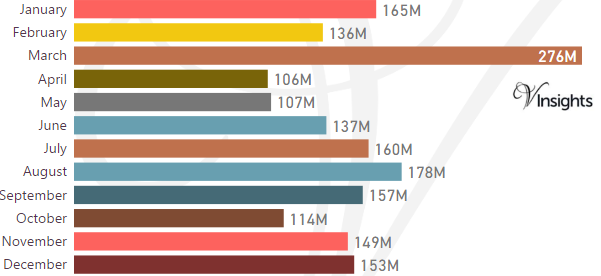
Some of the insights based on the £1.8 billions month-wise break-down :
Stamp Duty Hike Impact
- March had property sale spike of £276 millions compared to £136 millions in Feb and then sales sharply drop
- The impetus for it was to avoid the extra 3% in Stamp Duty Tax applicable on buying an additional home, being applicable from April 1 2016
Brexit Impact
- Brexit took place on 23rd June 2016.
- Year on Year decline has been 4.7% in 2016 over 2015
- Brexit coupled with Stamp Duty Hike had negative impact on Elmbridge Property Market in 2016
Total No Of Properties Sold By Property Type
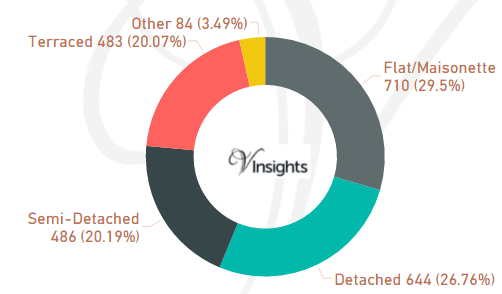
Elmbridge had total property sales of 2,407. The split across the different property types are:
- Flat/Maisonette 710 (29.5%)
- Detached 644 (26.76%)
- Semi-Detached 486 (20.19%)
- Terraced 483 (20.07%)
- Other 84 (3.49%)
Average & Median Sales Price
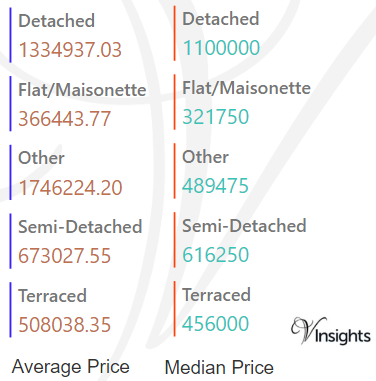
The average sales price in Elmbridge was £764 K and for different property types it was:
- Detached £1.3 millions
- Semi-Detached £673 K
- Terraced £508 K
- Flat/Maisonette £366 K
- Other it is £ 1.7 millions
Similarly median sales price in Elmbridge was £525 K and for different property types it was:
- Detached £1.1 millions
- Semi-Detached £616 K
- Terraced £456 K
- Flat/Maisonette £322 K
- Other it is £489 K
New Vs Not New Property Statistics
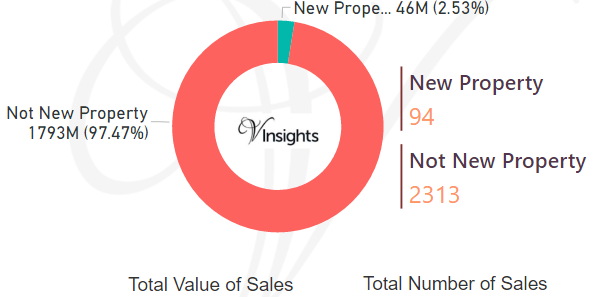
By Sales Value the split is as follows:
- New Property contributed £46 millions (2.53%)
- Not New Property contributed £1.8 billions (97.47%)
By Total Number the split is as follows:
- New properties sold were 94 (3.91%)
- Not new property sold were 2,313 (96.10%)
All Surrey Posts

f9de9482-5563-46e0-b7ea-beb859fcc71f|0|.0|27604f05-86ad-47ef-9e05-950bb762570c