Story Highlights
- Barnet had total property sales of £3.25 Billions in 2016
- The total number of properties sold was 5388
- In 2016 the Average property price was £603 K, while Median Price was £464 K
- Not New Property Contributed 82.7% and New Property 17.3% by Sales Value
- Stamp duty changes caused monthly spike in March
- Brexit coupled with Stamp Duty changes caused decline in total sales value by 3.5%
Barnet is one of the boroughs of North London. It had property sales of £3.25 Billions which was 49.26% of North London Property Market 2016 .
Total Sales By Property Type
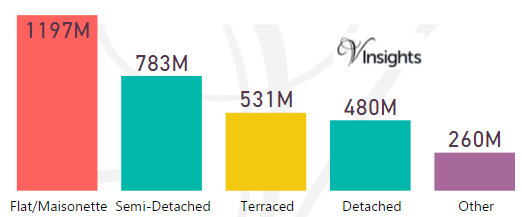
The split of £3.25 Billions across the different property types are:
- Flat/Maisonette £1.2 billions (36.82%)
- Semi-Detached £783 millions (24.08%)
- Terraced £531 millions (16.34%)
- Detached £480 millions (14.77%)
- Other £260 millions (7.99%)
Year on Year Comparison : Compared to Barnet Property Market 2015 in 2016
- All the property types have shown decline in sales except Flat/Maisonette, Other
- Flat/Maisonette has shown very modest growth of 9%
Barnet Property Market at Postcode level
| Postcode |
Coverage Area
|
Local Authority Area |
| EN4 |
Hadley Wood, Cockfosters, East Barnet, New Barnet
|
Barnet, Enfield |
| EN5 |
High Barnet, Arkley
|
Barnet, Hertsmere |
| HA7 |
Stanmore, Queensbury, Belmont (part)
|
Harrow, Brent, Barnet |
| HA8 |
Edgware, Burnt Oak, Canons Park, Queensbury
|
Barnet, Brent, Harrow |
| N2 |
East Finchley, Fortis Green, Hampstead Garden Suburb (part)
|
Barnet, Haringey |
| N3 |
Finchley, Church End, Finchley Central
|
Barnet |
| N10 |
Muswell Hill
|
Haringey, Barnet |
| N11 |
New Southgate, Friern Barnet, Bounds Green, Arnos Grove (part)
|
Enfield, Barnet, Haringey |
| N12 |
North Finchley, Woodside Park
|
Barnet |
| N14 |
Southgate, Oakwood, Arnos Grove (part)
|
Enfield, Barnet |
| NW2 |
Cricklewood district: Cricklewood, Dollis Hill, Childs Hill, Golders Green (part), Brent Cross (part), Willesden (north), Neasden (north)
|
Barnet, Brent, Camden |
| NW3 |
Hampstead district: Hampstead, Belsize Park, Frognal, Childs Hill (east), South Hampstead (north), Swiss Cottage (east), Primrose Hill (north), Chalk Farm (west), Gospel Oak
|
Camden, Barnet |
| NW4 |
Hendon district: Hendon, Brent Cross (part)
|
Barnet |
| NW7 |
Mill Hill district: Mill Hill, Arkley (part), Edgware (part)
|
Barnet |
| NW9 |
The Hyde district: The Hyde, Colindale, Kingsbury, West Hendon, Queensbury (part)
|
Barnet, Brent, Harrow |
| NW11 |
Golders Green district: Golders Green, Temple Fortune, Hampstead Garden Suburb (west), Hendon (part), Brent Cross (part)
|
Barnet |
For property market details at post code level please click on Postcode in the table above.
Month-wise Break-up of Total Sales
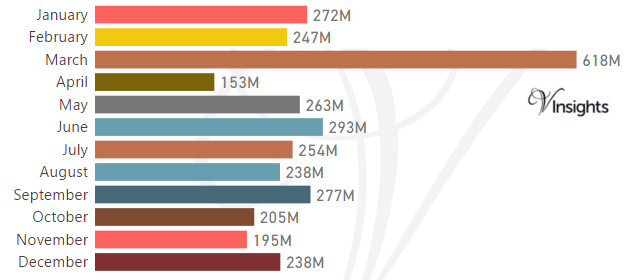
Stamp Duty Hike Impact
- March had property sale spike of £ 618 millions compared to £247 millions in Feb
- The impetus for it was to avoid the extra 3% in Stamp Duty Tax applicable on buying an additional home, being applicable from April 1 2016
Brexit Impact
- Brexit took place on 23rd June 2016.
- As can be observed from the month-wise break-up there has been dip in property sales in the immediate aftermath of Brexit
- Year on Year the property market for Barnet has shown a decline of 3.45% over 2015
Total No Of Properties Sold By Property Type
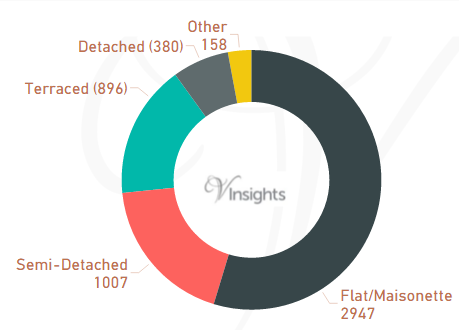
In Barnet the total number of properties sold in year 2016 was 5388. The breakdown by different property types are:
- Terraced 896 (16.63%)
- Semi-Detached 1007 (18.69%)
- Other 158 (2.93%)
- Flat/Maisonette 2947 (54.7%)
- Detached 380 (7.05%)
Year on Year Comparison : Compared to Barnet Property Market 2015 in 2016
- Total number of property sales in Barnet has declined by 3.9%
- All property types have shown decline in number of properties sold except property type Other, Flat/Maisonette
- Other has shown significant growth of 68% in number of properties sold
Average & Median Sales Price
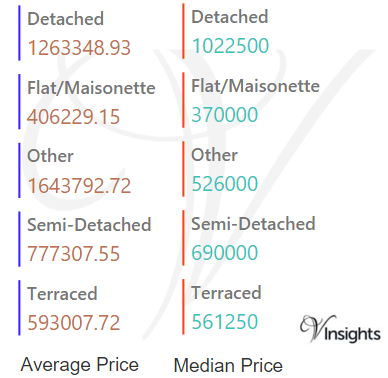
In 2016 the Average property price was £603 K in Barnet. The average price for the different property types was:
- Detached £1.26 millions
- Flat/Maisonette £406 K
- Other £1.64 millions
- Semi-Detached £777 K
- Terraced £593 K
The Median Price in Barnet was £464 K. The median property price for the different property types was:
- Detached £1.02 million
- Flat/Maisonette £370 K
- Other £526 K
- Semi-Detached £690 K
- Terraced £561 K
Year on Year Comparison : Compared to Barnet Property Market 2015
- The average and median sales price across all property types have gone up except for Others, Detached
New Vs Not New Property Statistics
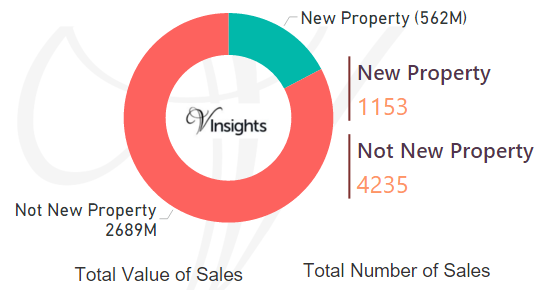
By Value Of Sales
- Not New Property contributed £2.7 billions (82.7%)
- New Property £562 millions (17.3%)
By Number Of Sales
- The number of Not New Property sold was 4235 (78.6%)
- The number of New Property sold was 1153 (21.4%)
Year on Year Comparison : Compared to Barnet Property Market 2015 in 2016
- New property market share in property market has gone up in 2016 over 2015
All London Posts
64e1c0f4-e213-41e9-9c33-cfa697bf4890|0|.0|27604f05-86ad-47ef-9e05-950bb762570c