For 2016 details - Kingston Upon Thames Property Market 2016
Story Highlights
- Kingston Upon Thames had total Property Sales of £1.6 billions in 2015.
- The total number of properties sold in year 2015 was 2740.
- The Average property price was £569 K in while Median was £409 K.
- Not New Property Contributed 95.71% and New Property 4.29% by sales value
Total Sales By Property Type
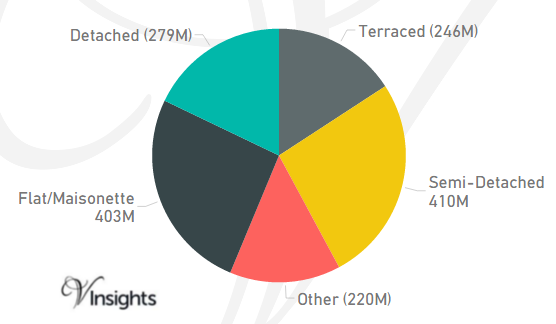
Kingston Upon Thames is one of the Boroughs of South London. It had total Property Sales of £1.6 billions which was 10.58% of South London Property Market 2015.
The split across the different property types are:
- Terraced £246 millions (15.81%)
- Semi-Detached £410 millions (26.34%)
- Other £220 millions (14.14%)
- Flat/Maisonette £403 millions (25.84%)
- Detached £279 millions (17.89%)
Total No Of Properties Sold By Property Type
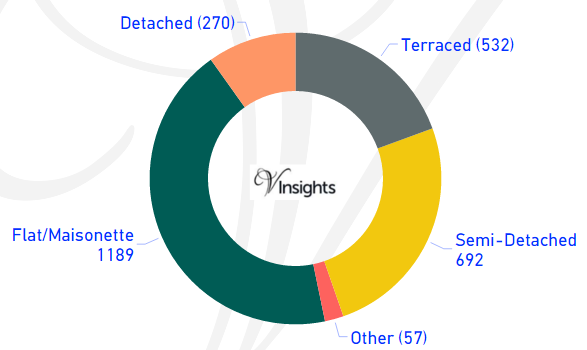
In Kingston Upon Thames the total number of properties sold in year 2015 was 2740.
The breakdown by different property types are:
- Terraced 532 (19.42%)
- Semi-Detached 692 (25.26%)
- Other 57 (2.08%)
- Flat/Maisonette 1189 (43.39%)
- Detached 270 (9.85%)
Average & Median Sales Price
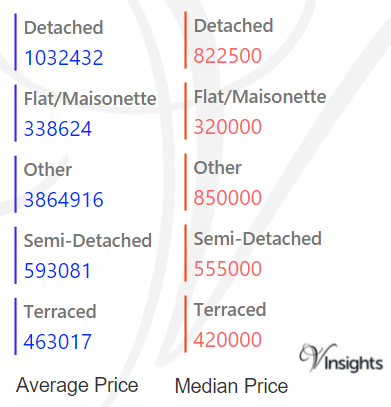
In 2015 the Average property price was £569 K in Kingston Upon Thames. The average price for the different property types are:
- Detached £1.03 million
- Flat/Maisonette £339 K
- Other £3.9 millions
- Semi-Detached £593 K
- Terraced £463 K
The Median Price was £409 K.The median property price for the different property types are:
- Detached £823 K
- Flat/Maisonette £320 K
- Other £850 K
- Semi-Detached £555 K
- Terraced £420 K
New Vs Not New Property Statistics
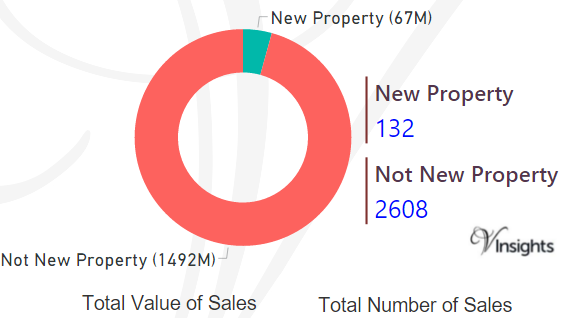
By Value Of Sales
- Not New Property contributed £1.49 billion (95.71%)
- New Property 67 millions (4.29%) giving combined total of £1.6 billions.
By Number Of Sales
- The number of Not New Property sold was 2608 (95.18%)
- The number of New Property sold was 132 (4.82%) giving combined total of 2740.
All London Posts
45b01061-e790-4886-9d6c-769678e50fc5|0|.0|27604f05-86ad-47ef-9e05-950bb762570c
For 2016 details - Croydon Property Market 2016
Story Highlights
- Croydon had total Property Sales of £2.45 billions in 2015.
- The total number of properties sold in year 2015 was 6426.
- The Average property price was £379 K in Croydon while Median was £300 K.
- Not New Property Contributed 93.02% and New Property 6.98% by Sales value
Total Sales By Property Type
Croydon is one of the Boroughs of South London. It had total Property Sales of £2.45 billions which was 16.54% of South London Property Market 2015 Property Market 2015.
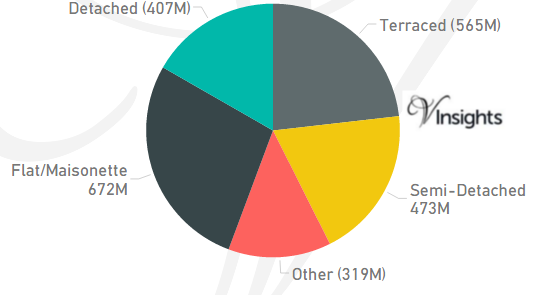
The split across the different property types are:
- Terraced £565 millions (23.19%)
- Semi-Detached £473 millions (19.41%)
- Other £319 millions (13.1%)
- Flat/Maisonette £672 millions (27.59%)
- Detached £407 millions (16.71%).
Total No Of Properties Sold By Property Type
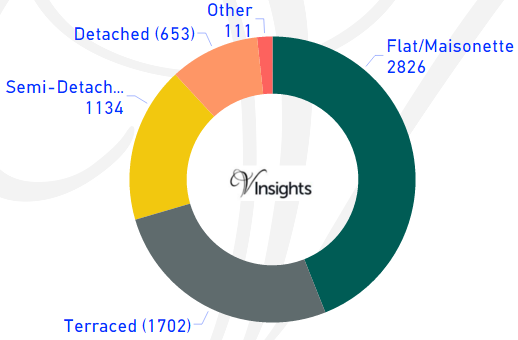
In Croydon the total number of properties sold in year 2015 was 6426. The breakdown by different property types are:
- Terraced 1702 (26.49%)
- Semi-Detached 1134 (17.65%)
- Other 111 (1.73%)
- Flat/Maisonette 2826 (43.98%)
- Detached 653 (10.16%)
Average & Median Sales Price
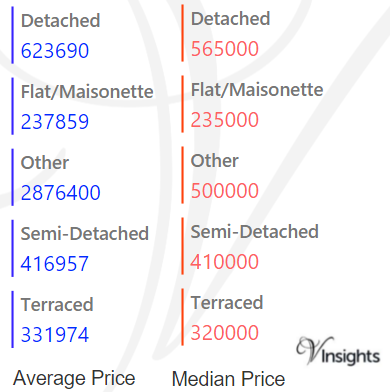
In 2015 the Average property price was £379 K in Croydon. The average property price for the different property types are:
- Detached £624 K
- Flat/Maisonette £238 K
- Other £2.88 millions
- Semi-Detached £417 K
- Terraced £332 K.
The Median Price was £300 K. The median property price for the different property types are:
- Detached £565 K
- Flat/Maisonette £235 K
- Other £500 K
- Semi-Detached £410 K
- Terraced £320 K
New Vs Not New Property Statistics
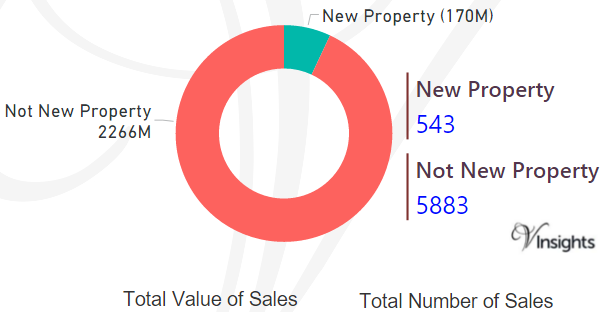
By Value Of Sales
- Not New Property contributed £2.27 billion (93.02%)
- New Property 170 millions (6.98%) giving combined total of £2.45 billions.
By Number Of Sales
- The number of Not New Property sold was 5883 (91.55%)
- The number of New Property sold was 543 (8.45%) giving combined total of 6426.
All London Posts
0a6fd8bf-0c4e-4382-a4bf-75cda58e15e2|0|.0|27604f05-86ad-47ef-9e05-950bb762570c
For 2016 details - Bromley Property Market 2016
Story Highlights
- Bromley had total Property Sales of £2.92 billions in 2015.
- The total number of properties sold in year 2015 was 6365.
- The Average property price was £459 K in Bromley while Median was £373 K.
- Not New Property contributed 92.64% and New Property 7.36% by value
Total Sales By Property Type
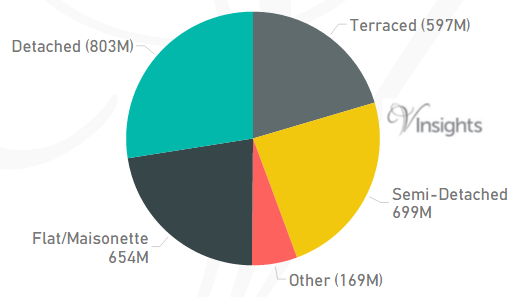
Bromley is one of the Boroughs of South London. It had total Property Sales of £2.92 billions which was 19.83% of South London Property Market 2015.
The split across the different property types are:
- Terraced £597 millions (20.43%)
- Semi-Detached £699 millions (23.93%)
- Other £169 millions (5.78%)
- Flat/Maisonette £654 millions (22.37%)
- Detached £803 millions (27.49%)
Total No Of Properties Sold By Property Type
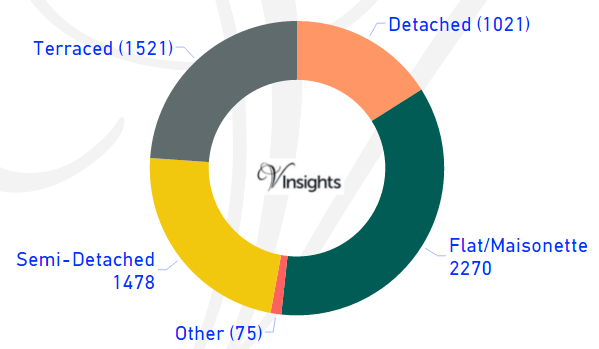
In Bromley the total number of properties sold in year 2015 was 6365.
The breakdown by different property types are:
- Terraced 1521 (23.9%)
- Semi-Detached 1478 (23.22%)
- Other 75 (1.18%)
- Flat/Maisonette 2270 (35.66%)
- Detached 1021 (16.04%).
Average & Median Sales Price
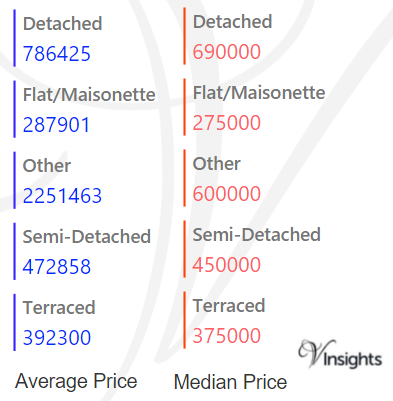
In 2015 the Average property price was £459 K in Bromley. The average price for the different property types are:
- Detached £786 K
- Flat/Maisonette £288 K
- Other £2.25 millions
- Semi-Detached £473 K
- Terraced £392 K
The Median Price was £373 K.The median property price for the different property types are
- Detached £690 K
- Flat/Maisonette £275 K
- Other £600 K
- Semi-Detached £450 K
- Terraced £375 K
New Vs Not New Property Statistics
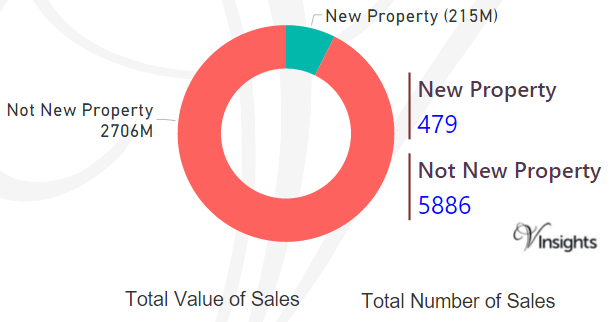
By Value Of Sales
- Not New Property contributed £2.71 billion (92.64%)
- New Property £215 millions (7.36%) giving combined total of £2.92 billions.
By Number Of Sales
- The number of Not New Property sold was 5886 (92.47%)
- The number of New Property sold was 479 (7.53%) giving combined total of 6365.
All London Posts
efd7028d-ace6-491d-9a7b-77af9907c476|0|.0|27604f05-86ad-47ef-9e05-950bb762570c

For 2016 details - South London Property Market 2016
Story Highlights
- South London in 2015 had total property sales of £15 billions
- Wandsworth was the leader contributing £4.6 billions (30.94%)
- The total number of property sold in South London 2015 was 28,761
- The average sales price in South London was £512 K and the median sales price was £385 K
- The average sales prices was maximum in the Borough of Wandsworth £703 K
- The sales value for New Property was 9.66% where for Not New Property was 90.34 %
South London is the southern part of London. South London boroughs in Greater London are Bromley, Croydon, Kingston upon Thames, Merton, Sutton and Wandsworth.
Total Sales By Property Type
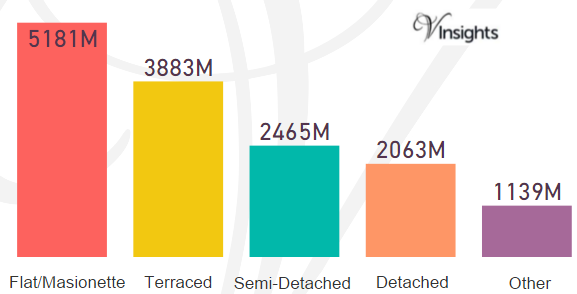
South London in 2015 had total property sales of £15 billions. It was 18.07% of the London Property Market 2015.
The split across the different property types are:
- Detached: £1.14 billions (14.01%)
- Semi-Detached: £2.063 billions (16.73%)
- Terraced: £3.88 billions (26.36%)
- Other: £1.14 billions (7.73%)
- Flat/Maisonette: £5.18 billions (35.17%)
Total Sales By Borough
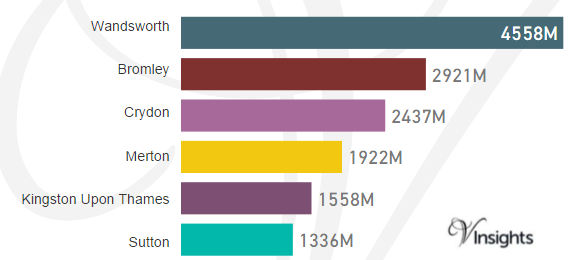
The total sales of £15 billions in 2015 was split across its borough as above.
Total Number Of Sales By Property Types
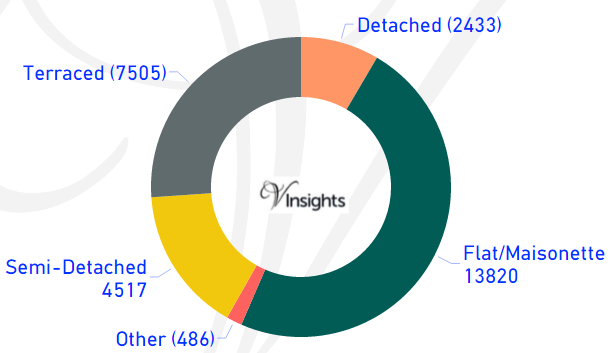
The total number of properties sold in South London 2015 was 28,761. It is split as:
- Detached: 2,433 (8.46%)
- Semi-Detached: 4,517 (15.71%)
- Terraced: 7,505 (26.09%)
- Flat/Maisonette: 13,820 (48.05%)
- Other: 486 (1.69%)
Average & Median Sales Price
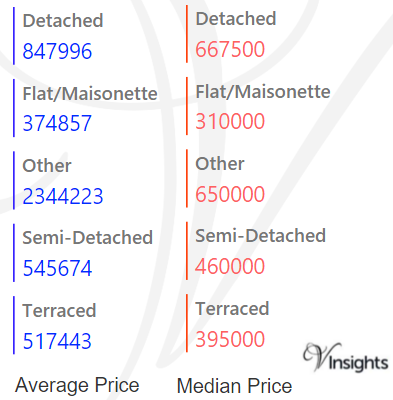
The average sales price in South London was £512 K. For the different property types it was:
- Detached: £848 K
- Semi-Detached: £546 K
- Terraced: £517 K
- Flat/Maisonette: £375 K
- Other it is £2.34 millions.
Similarly the median sales price in South London was £385 K. For the different property types it was:
- Detached: £668 K
- Semi-Detached: £460 K
- Terraced: £395 K
- Flat/Maisonette: £310 K
- Other it is £650 K.
Average & Median Sales Price By Borough
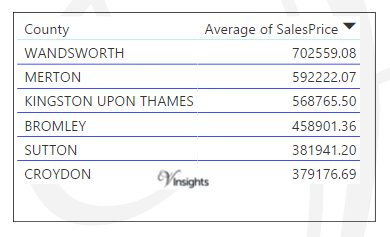
In South London the Average Sales Price is as above.
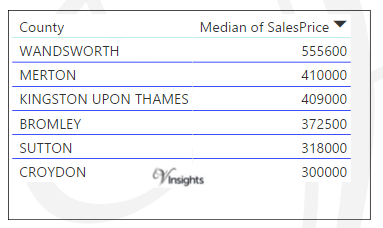
In South London the Median Sales Price is as above.
New Vs Not New Property Statistics
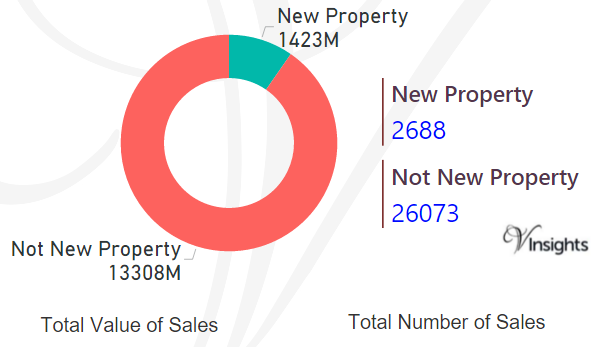
By Value Of Sales
- The sales value contributed by New Property was £1.423 billions (9.66%)
- Not New Property contributed £13.31 billions (90.34 %).
By Number Of Sales
- New properties sold were 2,688 (9.35%)
- Not new property sold were 26,073 (90.65%).
All London Posts
5b0a720c-5124-4b7d-a5c1-c94186511bad|0|.0|27604f05-86ad-47ef-9e05-950bb762570c