For 2016 details - Lewisham Property Market 2016
Story Highlights
- Lewisham had total Property Sales of £2.286 billions in 2015.
- The total number of properties sold in year 2015 was 5004.
- The Average property price was £457 K in Lewisham while Median was was £355 K.
- Not New Property Contributed 88.65% by value and New Property 11.35%
Total Sales By Property Type
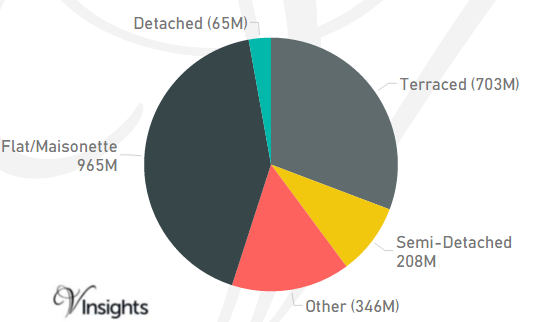
Lewisham is one of the Boroughs of East London. It had total Property Sales of £2.286 billions which was 13.97% of East London Property Market 2015.
The split across the different property types are:
- Terraced £703 millions (30.75%)
- Semi-Detached £208 millions (9.11%)
- Other £346 millions (15.12%)
- Flat/Maisonette £965 millions (42.19%)
- Detached £65 millions (2.83%).
Total No Of Properties Sold By Property Type
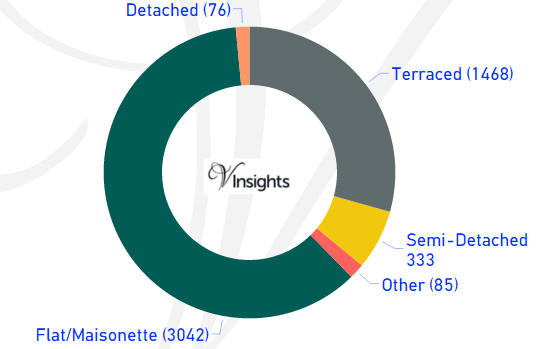
In Lewisham the total number of properties sold in year 2015 was 5004. The breakdown by different property types are:
- Terraced 1468 (29.34%)
- Semi-Detached 333 (6.65%)
- Other 85 (1.7%)
- Flat/Maisonette 3042 (60.79%)
- Detached 76 (1.52%).
Average & Median Sales Price
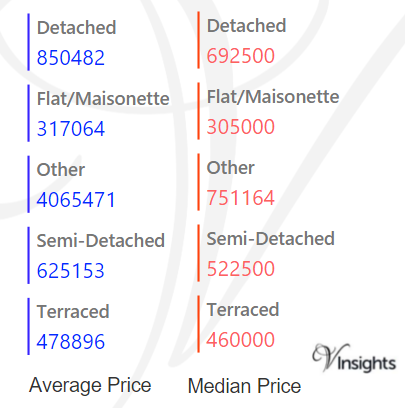
In 2015 the Average property price was £457 K in Lewisham. The average price for the different property types are:
- Detached £851 K
- Flat/Maisonette £317 K
- Other £4.07 millions
- Semi-Detached £625 K
- Terraced £479 K.
The Median Price was £355 K. The median property price for the different property types are:
- Detached £693 K
- Flat/Maisonette £305 K
- Other £751 K
- Semi-Detached £523 K
- Terraced £460 K.
New Vs Not New Property Statistics
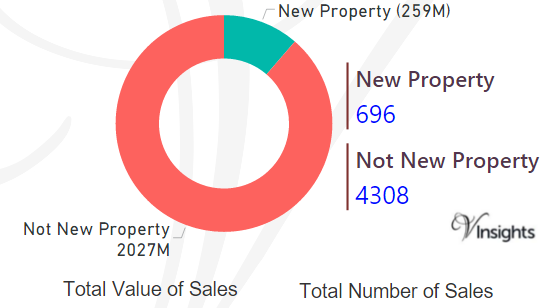
By Value Of Sales
- Not New Property contributed £2.03 billion (88.65%)
- New Property £259 millions (11.35%) giving combined total of £2.286 billions .
By Number Of Sales
- The number of Not New Property sold was 4308 (86.09%)
- The number of New Properties sold was 696 (13.91%) giving combined total of 4464.
All London Posts

77824cd2-ae44-4ec6-a8ec-06fb0cde7e57|0|.0|27604f05-86ad-47ef-9e05-950bb762570c
For 2016 details - Havering Property Market 2016
Story Highlights
- Havering had total Property Sales of £1.44 billions in 2015
- The total number of properties sold in year 2015 was 4464
- The Average property price was £323 K in Havering while Median was was £285 K
- Not New Property Contributed 88.48% and New Property 11.52%
Total Sales By Property Type
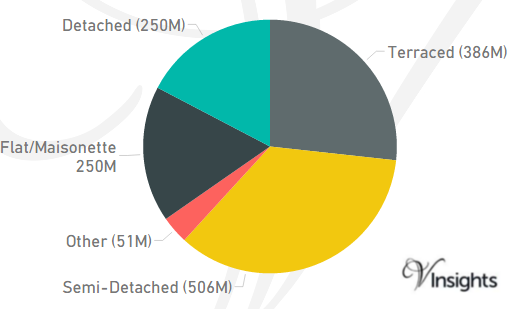
Havering is one of the Boroughs of East London. It had total Property Sales of £1.44 billions which was 8.82% of East London Property Market 2015.
The split across the different property types are:
- Terraced £386 millions (26.74%)
- Semi-Detached £506 millions (35.06%)
- Other £51 millions (3.53%)
- Flat/Maisonette £250 millions (17.34%)
- Detached £250 millions (17.33%).
Total No Of Properties Sold By Property Type
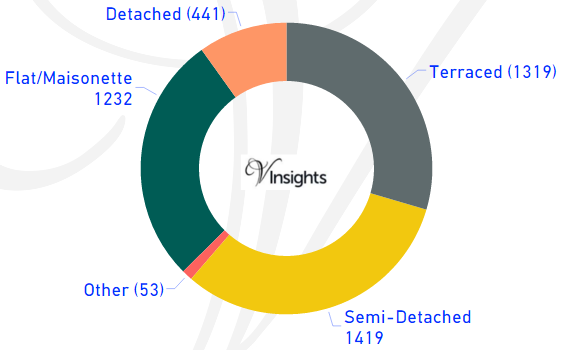
In Havering the total number of properties sold in year 2015 was 4464. The breakdown by different property types are:
- Terraced 1319 (29.55%)
- Semi-Detached 1419 (31.79%)
- Other 53 (1.19%)
- Flat/Maisonette 1232 (27.6%)
- Detached 441 (9.88%).
Average & Median Sales Price
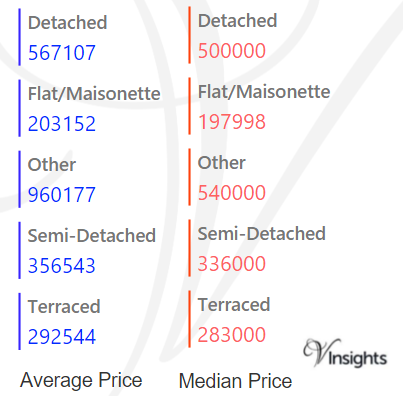
In 2015 the Average property price was £323 K in Havering. The average price for the different property types are:
- Detached £567 K
- Flat/Maisonette £203 K
- Other £960 K
- Semi-Detached £357 K
- Terraced £293 K.
The Median Price was £285 K. The median property price for the different property types are:
- Detached £500 K
- Flat/Maisonette £198 K
- Other £540 K
- Semi-Detached £336 K
- Terraced £283 K.
New Vs Not New Property Statistics
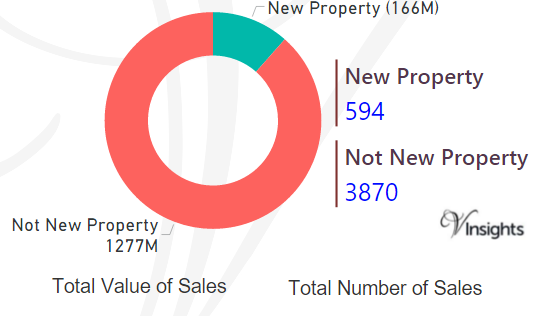
By Value Of Sales
- Not New Property contributed £1.28 billion (88.48%)
- New Property 166 millions (11.52%) giving combined total of £1.44 billions .
By Number Of Sales
- The number of Not New Property sold was 3870 (86.69%)
- The number of New Properties sold was 594 (13.31%) giving combined total of 4464.
All London Posts
08d2c3c1-fd5b-4f98-85e1-3608e42cd0a2|0|.0|27604f05-86ad-47ef-9e05-950bb762570c
For 2016 details - Hackney Property Market 2016
Story Highlights
- Hackney had total Property Sales of £2.01 billions in 2015
- The total number of properties sold in year 2015 was 3293
- The Average property price was £611 K in Hackney while Median was £483 K
- Not New Property contributed 75.6% by value and New Property 24.4%
Total Sales By Property Type
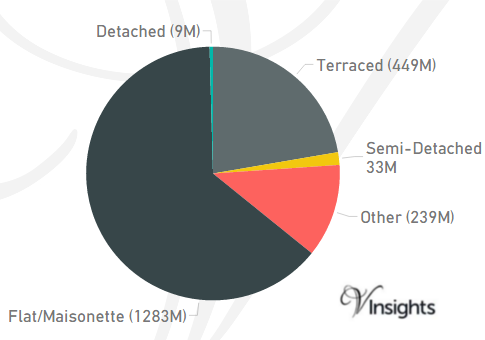
Hackney is one of the Boroughs of East London. It had total Property Sales of £2.01 billions which was 12.29 % of East London Property Market 2015.
The split across the different property types are:
- Terraced £449 millions (22.3%)
- Semi-Detached £33 millions (1.62%)
- Other £239 millions (11.89%)
- Flat/Maisonette £1.28 billions (63.76%)
- Detached £9 millions (0.43%).
Total No Of Properties Sold By Property Type
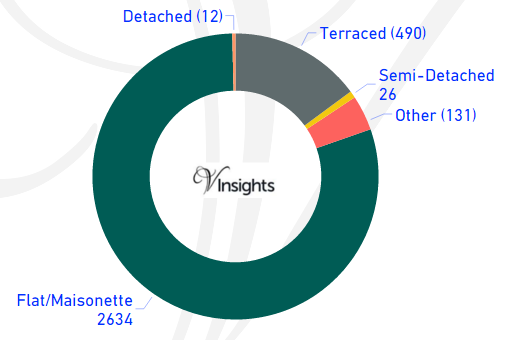
In Hackney the total number of properties sold in year 2015 was 3293. The breakdown by different property types are:
- Terraced 490 (14.88%)
- Semi-Detached 26 (0.79%)
- Other 131 (3.98%)
- Flat/Maisonette 2634 (79.99%)
- Detached 12 (0.36%).
Average & Median Sales Price
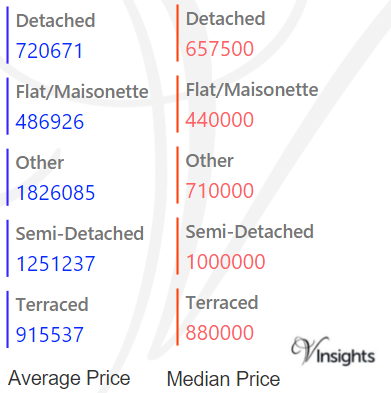
In 2015 the Average property price was £611 K in Hackney. The average price for the different property types are:
- Detached £721 K
- Flat/Maisonette £487 K
- Other £1.83 millions
- Semi-Detached £1.25 millions
- Terraced £916 K.
The Median Price was £483 K. The median property price for the different property types are:
- Detached £658 K
- Flat/Maisonette £440 K
- Other £710 K
- Semi-Detached £1 million
- Terraced £880 K.
New Vs Not New Property Statistics
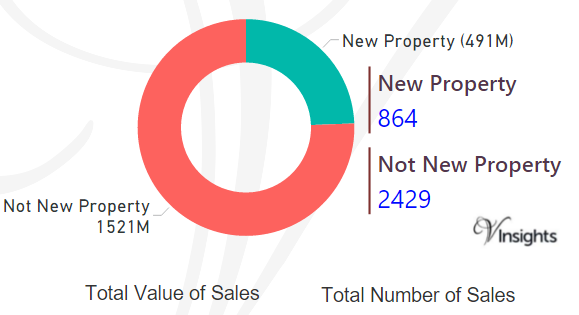
By Value Of Sales
- Not New Property Contributed £1.52 billion (75.6%)
- New Property 491 millions (24.4%) giving combined total of £2.01 billions.
By Number Of Sales
- The number of Not New Property sold was 2429 (73.76%)
- The number of New Properties sold was 864 (26.24%) giving combined total of 3293.
All London Posts
0321a3e2-8c23-4d80-8b44-6045706038b1|0|.0|27604f05-86ad-47ef-9e05-950bb762570c
For 2016 details - Greenwich Property Market 2016
Story Highlights
- Greenwich had total Property Sales of £1.93 billions in 2015.
- The total number of properties sold in year 2015 was 4467.
- The Average property price was £432 K in Greenwich while Median was £345 K.
-
Not New Property Contributed £1.52 billion (78.83%) and New Property 408 millions (21.17%) giving combined total of £1.93 billions.
-
The number of Not New Property sold was 3525 (78.91%), whereas the number of New Property sold was 942 (21.09%) giving combined total of 4467
Total Sales By Property Type
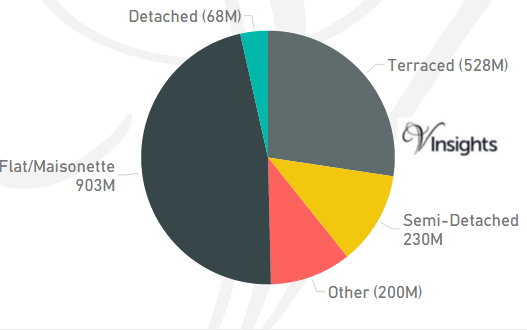
Greenwich is one of the Boroughs of East London. It had total Property Sales of £1.93 billions which was 11.79 % of East London Property Market 2015 Property Market 2015.
The split across the different property types are:
- Terraced £528 millions (27.37%)
- Semi-Detached £230 millions (11.9%)
- Other £200 millions (10.35%)
- Flat/Maisonette £903 millions (46.84%)
- Detached £68 millions (3.53%).
Total No Of Properties Sold By Property Type
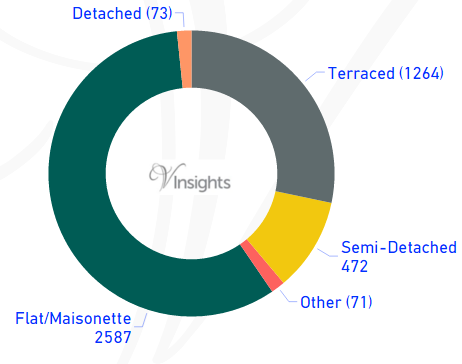
In Greenwich the total number of properties sold in year 2015 was 4467. The breakdown by different property types are:
- Terraced 1264 (28.3%)
- Semi-Detached 472 (10.57%)
- Other 71 (1.59%)
- Flat/Maisonette 2587 (57.91%)
- Detached 73 (1.63%).
Average & Median Sales Price
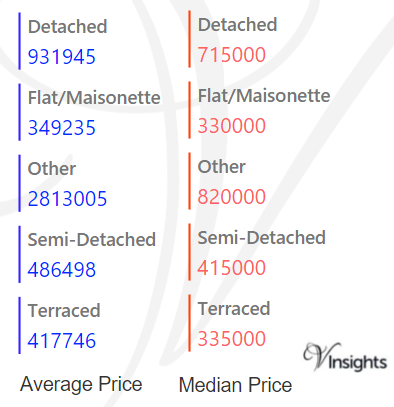
In 2015 the Average property price was £432 K in Greenwich. The average price for the different property types are:
- Detached £932 K
- Flat/Maisonette £349 K
- Other £2.81 millions
- Semi-Detached £487 K
- Terraced £418 K.
The Median Price was £345 K. The median property price for the different property types are:
- Detached £715 K
- Flat/Maisonette £330 K
- Other £820 K
- Semi-Detached £415 K
- Terraced £335 K.
New Vs Not New Property Statistics
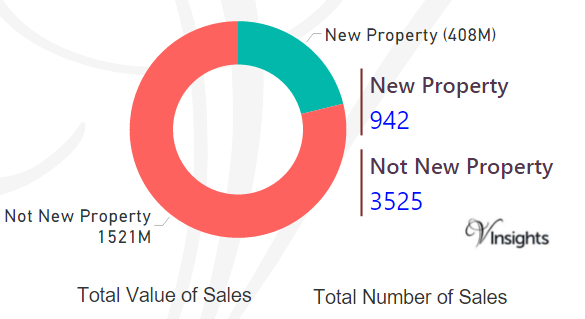
By Value Of Sales
- Not New Property Contributed £1.52 billion (78.83%)
- New Property 408 millions (21.17%) giving combined total of £1.93 billions.
By Number Of Sales
- The number of Not New Property sold was 3525 (78.91%)
- The number of New Properties sold was 942 (21.09%) giving combined total of 4467.
All London Posts
808b646b-326a-428c-9e2c-aa2d5754cc1c|0|.0|27604f05-86ad-47ef-9e05-950bb762570c
For 2016 details - Bexley Property Market 2016
Story Highlights
- Bexley had total Property Sales of £1.27 billions in 2015.
- The total number of properties sold in year 2015 was 4240.
- The Average property price was £300 K in Bexley, while Median was £275 K.
- Not New Property Contributed £1.149 billion (90.48%) and New Property 121 millions (9.52%) giving combined total of £1.27 billions.
- The number of Not New Property sold was 3709 (87.48%), whereas the number of New Property sold was 531 (12.52%) giving combined total of 4240.
Total Sales By Property Type
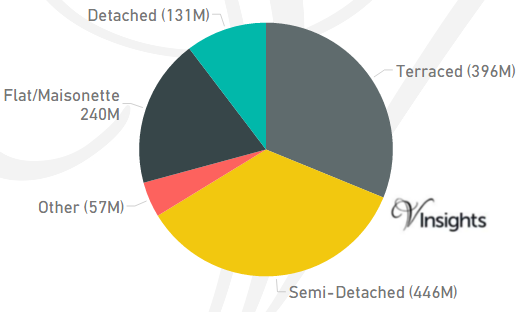
Bexley is one of the Boroughs of East London. It had total Property Sales of £1.27 billions which was 7.76% of East London Property Market 2015.
The split across the different property types are:
- Terraced £396 millions (31.18%)
- Semi-Detached £446 millions (35.08%)
- Other £57 millions (4.52%)
- Flat/Maisonette £240 millions (18.88%)
- Detached £131 millions (10.34%).
Total No Of Properties Sold By Property Type
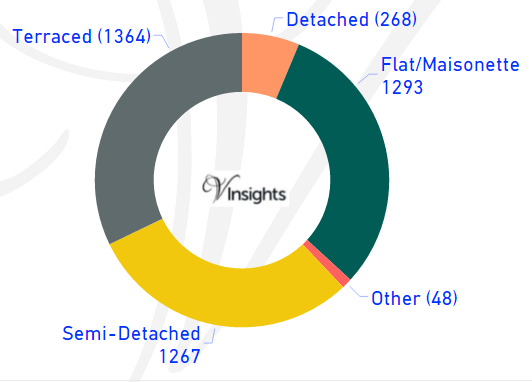
In Bexley the total number of properties sold in year 2015 was 4240. The breakdown by different property types are:
- Terraced 1364 (32.17%)
- Semi-Detached 1267 (29.88%)
- Other 48 (1.13%)
- Flat/Maisonette 1293 (30.5%)
- Detached 268 (6.32%).
Average & Median Sales Price
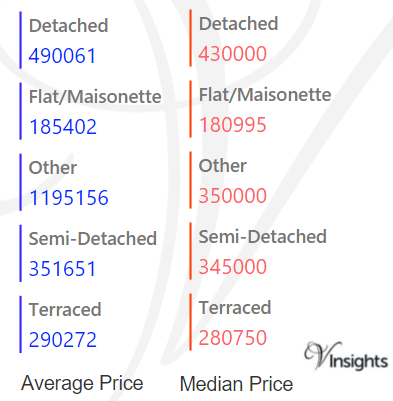
In 2015 the Average property price was £300 K in Bexley. The average property price for the different property types are:
- Detached £490 K
- Flat/Maisonette £185.4 K
- Other £1.195 millions
- Semi-Detached £352 K
- Terraced £290 K .
The Median Price was £275 K. The median property price for the different property types are:
- Detached £430 K
- Flat/Maisonette £181 K
- Other £350 K
- Semi-Detached £345 K
- Terraced £281 K.
New Vs Not New Property Statistics
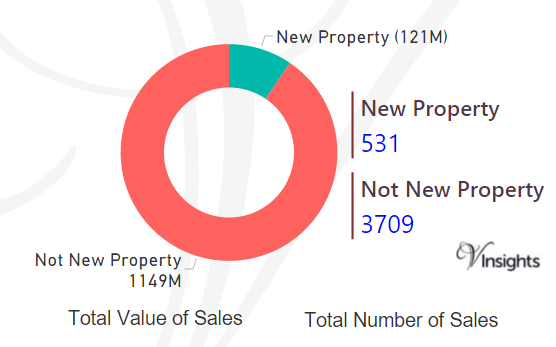
By Value Of Sales
- Not New Property Contributed £1.149 billion (90.48%)
- New Property 121 millions (9.52%) giving combined total of £1.27 billions.
By Number Of Sales
- The number of Not New Property sold was 3709 (87.48%)
- The number of New Properties sold was 531 (12.52%) giving combined total of 4240.
All London Posts
e6d38794-ce1b-43f8-8460-1ac9da1d1b00|0|.0|27604f05-86ad-47ef-9e05-950bb762570c