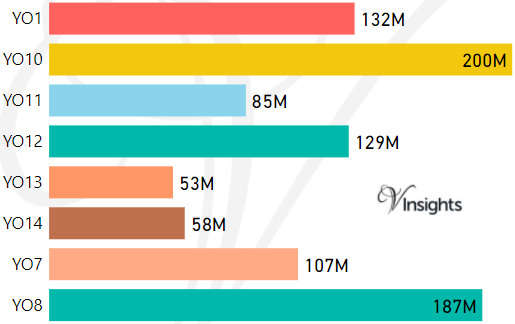
YO Postcode Area - YO1, YO7, YO8, Y10, YO11, YO12, YO13, YO14 Property Market 2017

Please click here for the updated version of this post

This Post covers 


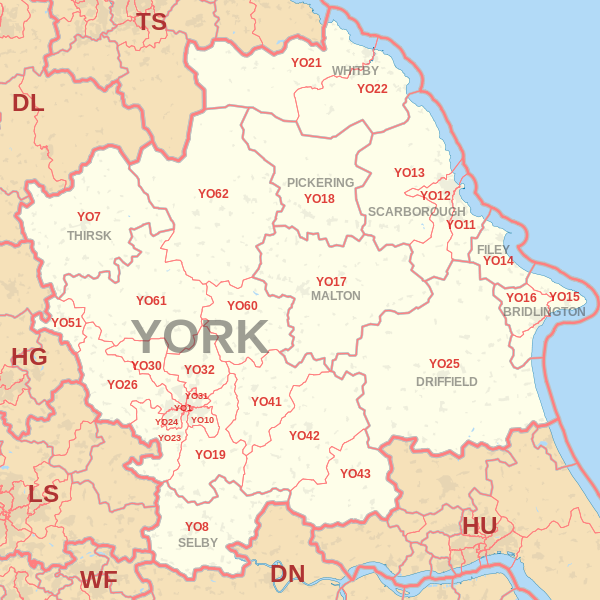
Coverage Area of Postcode YO1 to YO14

Postcode                 Coverage Area          Local Authority Area
YO1 City Centre York
YO7  Dalton, Hambleton, Thirsk, Topcliffe Hambleton,Harrogate
YO8 Barlby, Brayton, Bubwith, Cawood, Camblesforth, Drax, Thorpe Willoughby  
YO10 Fishergate, Fulford, Heslington, Osbaldwick, Tang Hall York
YO11  Cayton Scarborough
YO12  Seamer Scarborough
YO13 Scarborough Scarborough
YO14 Filey Scarborough


  • M represents Million Pounds
  • Total value includes Property Type Other apart from Detached, Semi-Detached, Terraced, Flat/Masionette


Postcode Detached Semi-Detached Terraced Flat
YO1   £350K £654K £240K
YO2        
YO7 £324K £212K £200K £102K
YO8 £261K £165K £137K £88K
YO10 £411K £241K £252K £140K
YO11 £260K £153K £136K £102K
YO12 £248K £164K £119K £126K
YO13 £290K £210K £185K £178K
YO14 £229K £152K £140K £119K


Postcode Detached Semi-Detached Terraced Flat
YO1   £350K £355K £210K
YO2        
YO7 £289K £194K £179K £85K
YO8 £249K £157K £132K £80K
YO10 £363K £230K £200K £127K
YO11 £222K £142K £119K £90K
YO12 £235K £159K £115K £115K
YO13 £285K £182K £189K £165K
YO14 £205K £148K £125K £96K


Postcode Detached SemiDetached Terraced Flat
YO1     £811K £91K
YO2        
YO7 £128K £80K £72K £45K
YO8 £80K £45K £50K £20K
YO10 £180K £49K £115K £40K
YO11 £141K £47K £65K £49K
YO12 £80K £39K £31K £60K
YO13 £103K £68K £53K £72K
YO14 £86K £33K £49K £57K
For example
  • Say the average detached property price for postcode XYZ is £300 K and ST. DEV. is £30 K.
  • It means that most detached properties in postcode XYZ (about 68%) has price within one ST. Dev. i.e. the price range is  £270K - £330K.
  • All-most all detached property price (95%) in postcode XYZ lie between two ST. Dev.  i.e. £240 K - £360 K


Postcode Detached Semi-Detached Terraced Flat
YO1 0 1 25 255
YO2 0 0 0 0
YO7 151 91 86 76
YO8 353 284 234 34
YO10 36 128 105 215
YO11 60 136 85 194
YO12 124 254 284 114
YO13 106 49 26 6
YO14 106 100 54 76


The Table below gives in percentage, the total number of properties purchased as Buy-To-Let:
Postcode Detached Semi-Detached Terraced Flat
YO1 0% 0% 8% 11%
YO2 0% 0% 0% 0%
YO7 4% 7% 10% 43%
YO8 3% 5% 13% 3%
YO10 3% 8% 9% 20%
YO11 0% 3% 13% 6%
YO12 2% 3% 6% 18%
YO13 4% 2% 8% 17%
YO14 4% 3% 4% 3%
*Buy-to-let consists of Buy-to-lets (where they can be identified by a Mortgage) ,transfers to non-private individuals,  transfers under a power of sale/repossessions


Schools for Postcode Area YO


Property Posts for Postcode Area YO


Comments are closed