4. March 2018 17:59
/
VInsights Team
/
/
Comments (0)
Please click here for the updated version of this post
This Post covers
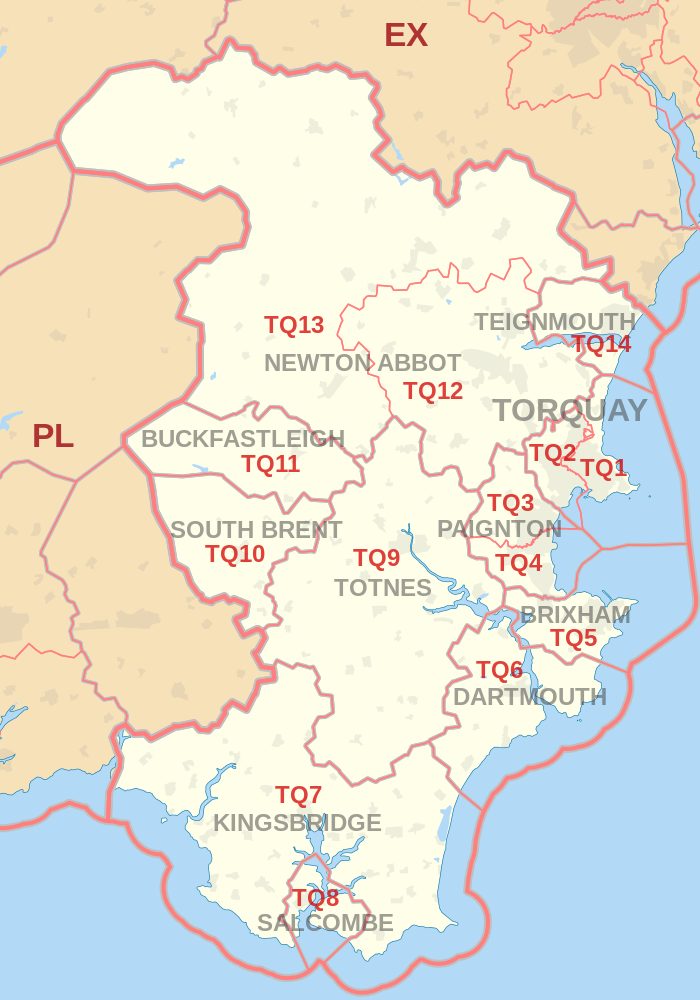 |
| Postcode |
Coverage Area |
Local Authority Area |
| TQ1 |
Torquay (centre), St Marychurch |
Torbay |
| TQ2 |
Torquay (west, north) |
Torbay |
| TQ3 |
Paignton (north, Preston area) |
Torbay |
| TQ4 |
Paignton (centre), Goodrington |
Torbay |
| TQ5 |
Brixham |
Torbay |
| TQ6 |
Dartmouth |
South Hams |
| TQ7 |
Kingsbridge |
South Hams |
| TQ8 |
Salcombe |
South Hams |
| TQ9 |
Totnes, Ivybridge |
South Hams |
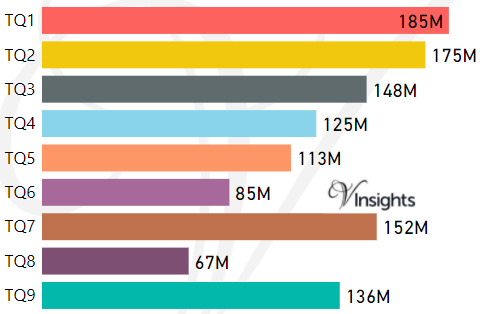
- M represents Million Pounds
- Total value includes Property Type Other apart from Detached, Semi-Detached, Terraced, Flat/Masionette
- TQ Postcode Area - TQ1, TQ2, TQ3, TQ4, TQ5, TQ6, TQ7, TQ8, TQ9 School Details
- TQ Postcode Area - TQ10, TQ11, TQ12, TQ13, TQ14 School Details
All TQ Postcodes Yearly & Trend Analysis Posts

Reference
TQ Postcode Area As Per Wikipedia
e6fe04e1-854d-415c-9868-fee8654dee25|0|.0|27604f05-86ad-47ef-9e05-950bb762570c
Tags :