Story Highlights
- Oxfordshire had total property sales of £4.7 Billions in 2016,
- The year-on-year growth witnessed was 0.4%
- Stamp duty hike caused monthly spike in March
- The average sales price in Oxfordshire was £421 K, whereas median was £326 K
- Across its districts average sales price in Oxfordshire was maximum for Oxford at £541 K and was minimum for Cherwell at £336 K
- New Property sales were 12.35% by value, whereas Not New Property contributed 87.65%
Oxfordshire is one of the counties of South East England. The districts of Oxfordshire are South Oxfordshire, Vale Of White Horse, Cherwell, Oxford, West Oxfordshire. Let us look at the Oxfordshire Property Market in 2016 in detail.
Total Sales By Districts
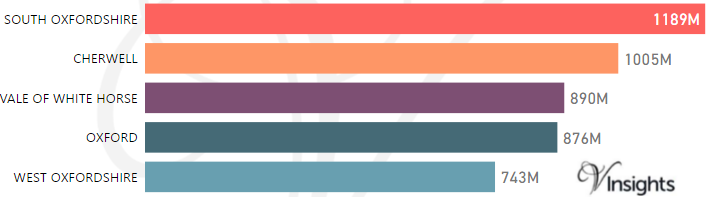
Oxfordshire had total property sales of £4.7 Billions which was 7.58% of the total South East property Market in 2016
The split of the sales across the different districts was:
Year on Year Comparison : Compared to Oxfordshire Property Market 2015 in 2016
Total Sales By Property Type
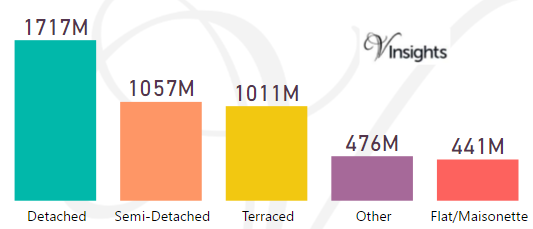
The split of £4.7 Billions in Oxfordshire across the different property types are:
- Detached £1.72 billions (36.52%)
- Semi-Detached £1.06 billions (22.48%)
- Terraced £1.01 billions (21.51%)
- Other £476 millions (10.12%)
- Flat/Maisonette £441 millions (9.37%)
Year on Year Comparison : Compared to Oxfordshire Property Market 2015 in 2016
- All the property types sales have shown decline except Other.
Month-wise Break-up of Total Sales
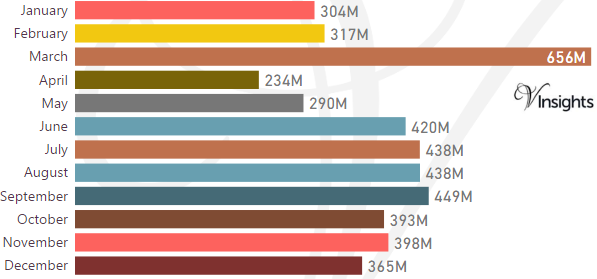
Some of the insights based on the £4.7 Billions month-wise break-down :
Stamp Duty Hike Impact
- March had property sale spike of £656 millions compared to £317 millions in Feb
- The impetus for it was to avoid the extra 3% in Stamp Duty Tax applicable on buying an additional home, being applicable from April 1 2016
Brexit Impact
- Brexit took place on 23rd June 2016.
- As can be observed from the month-wise break-up there does not seem to have been dip in property sales in the immediate aftermath of Brexit
- Year on Year increase (compared to 2015) has been 0.4% in 2016
- Brexit coupled with Stamp Duty Hike arrested growth of Oxfordshire Property Market in 2016
Total No Of Properties Sold By Property Type
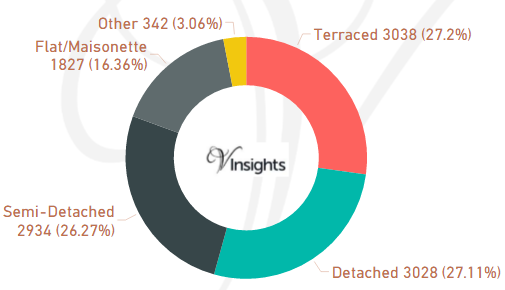
Oxfordshire had total property sales of 11,169. The split across different property types are:
- Terraced 3,038 (27.2%)
- Detached 3,028 (27.11%)
- Semi-Detached 2,934 (26.27%)
- Flat/Maisonette 1,827 (16.36%)
- Other 342 (3.06%)
Year on Year Comparison : Compared to Oxfordshire Property Market 2015 in 2016
- Total number of property sales in 2016 has decreased by 6.15%.
- All property types have shown decline in number of properties sold except property type Other
- Other has shown significant increase of 61.3%
Average & Median Sales Price
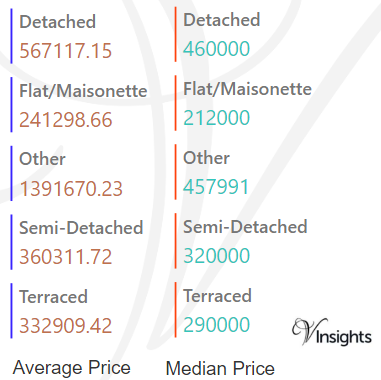
The average sales price in Oxfordshire was £421 K. For the different property types it was
- Detached at £567 K
- Semi-Detached at £360 K
- Terraced at £333 K
- Flat/Maisonette at £241 K
- Other it is at £1.4 millions
Similarly median sales price in Oxfordshire was £326 K. For different property types it was
- Detached at £460 K
- Semi-Detached at £320 K
- Terraced at £290 K
- Flat/Maisonette at £212 K
- Other it is at £458 K
Year on Year Comparison : Compared to Oxfordshire Property Market 2015 in 2016
- The average property price have gone up except for property type Other
- All the property types have gone up for median property price.
Average & Median Sales Price By Districts
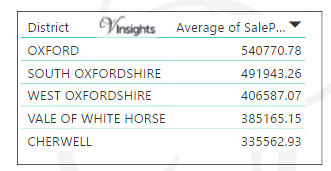
Across districts the average sales price is as above.
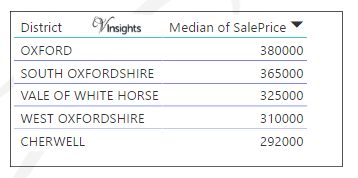
Across districts the median sales price is as above.
Year on Year Comparison : Compared to Oxfordshire Property Market 2015 in 2016
- The average and median sales price across all the counties have gone up
New Vs Not New Property Statistics
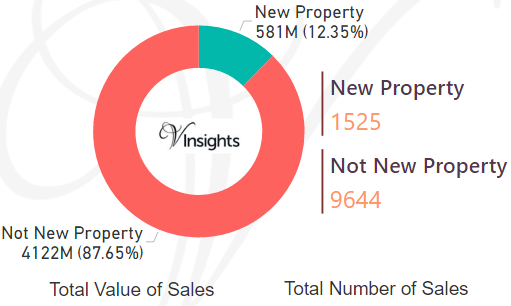
By Sales Value the split is as follows:
- New Property contributed £581 millions (12.35%)
- Not New Property contributed £4.12 billions (87.65%)
By Total Number the split is as follows:
- New properties sold were 1,525 (13.65%)
- Not new property sold were 9,644 (86.35%)
Year on Year Comparison : Compared to Oxfordshire Property Market 2015 in 2016
- New property market share in property market has gone marginally up.
All Oxfordshire Posts

79cfb37f-e66f-4692-8d7c-0c758d8ec20e|0|.0|27604f05-86ad-47ef-9e05-950bb762570c