17. February 2018 12:48
/
VInsights Team
/
/
Comments (0)
This Post covers
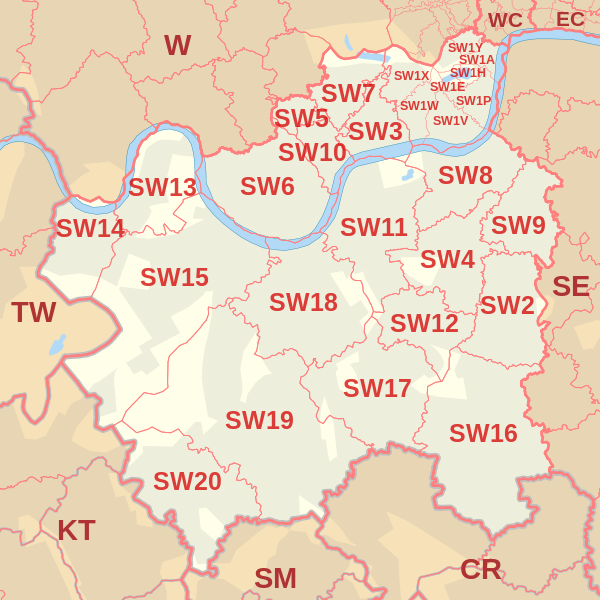
- Coverage Area of Postcode SW1A to SW1Y
- Total Values of Properties Sold in 2017
- Average Sales Price in 2017
- Median Sales Price in 2017
- Standard Deviation of Sales Price in 2017
- Total Number of Properties Sold in 2017
- Total Number of Buy-To-Let Properties in 2017
- Multi Year Property Trend Analysis
- Schools for Postcode Area SW
- Posts for Postcode Area
Coverage Area of Postcode SW1A to SW1Y
 |
| Postcode |
Coverage Area |
Local Authority Area |
| SW1A |
Whitehall and Buckingham Palace |
Westminster |
| SW1E |
Between Buckingham Gate and Victoria Station |
Westminster |
| SW1H |
East of Buckingham Gate |
Westminster |
| SW1P |
Triangular area between Victoria Station, the Houses of Parliament, and Vauxhall Bridge |
Westminster |
| SW1V |
Triangular area between Vauxhall Bridge, Chelsea Bridge, and Victoria Station; Pimlico proper |
Westminster |
| SW1W |
Belgravia, Chelsea (part), area between Sloane Square and Victoria Station, south of Kings Road |
Kensington and Chelsea, Westminster |
| SW1X |
Belgravia, north of Eaton Square, Knightsbridge (part), Chelsea (part) |
Kensington and Chelsea, Westminster |
| SW1Y |
St James's |
Westminster |
Total Value of Properties Sold in 2017
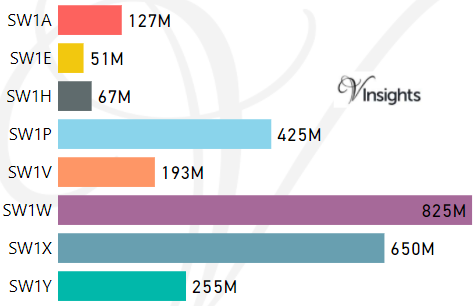
*M represents millions
*Total value includes Property Type Other apart from Detached, Semi-Detached, Terraced, Flat/Masionette
Average Sales Price in 2017
| Postcode |
Detached |
Semi-Detached |
Terraced |
Flat |
| SW1A |
|
|
|
£2726K |
| SW1E |
|
|
|
£2000K |
| SW1H |
|
|
£7500K |
£1592K |
| SW1P |
|
|
£1980K |
£1424K |
| SW1V |
£1475K |
|
£1850K |
£853K |
| SW1W |
|
|
£4567K |
£1557K |
| SW1X |
£4800K |
£4900K |
£4673K |
£4010K |
| SW1Y |
|
|
|
£2550K |
Median Sales Price in 2017
| Postcode |
Detached |
Semi-Detached |
Terraced |
Flat |
| SW1A |
|
|
|
£2000K |
| SW1E |
|
|
|
£1225K |
| SW1H |
|
|
£7500K |
£1085K |
| SW1P |
|
|
£1950K |
£1134K |
| SW1V |
£1475K |
|
£1890K |
£722K |
| SW1W |
|
|
£3900K |
£1156K |
| SW1X |
£3650K |
£4900K |
£4080K |
£2700K |
| SW1Y |
|
|
|
£970K |
Standard Deviation of Sales Price in 2017
| Postcode |
Detached |
SemiDetached |
Terraced |
Flat |
| SW1A |
|
|
|
£1938K |
| SW1E |
|
|
|
£2428K |
| SW1H |
|
|
|
£1066K |
| SW1P |
|
|
£418K |
£846K |
| SW1V |
|
|
£621K |
£487K |
| SW1W |
|
|
£3494K |
£1231K |
| SW1X |
£1626K |
|
£2440K |
£4479K |
| SW1Y |
|
|
|
£2326K |
For example,
- Say the average detached property price for postcode XYZ is £300 K and ST. DEV. is £30 K.
- It means that most detached properties in postcode XYZ (about 68%) has price within one ST. Dev. i.e. the price range is £270K - £330K.
- All-most all detached property price (95%) in postcode XYZ lie between two ST. Dev. i.e. £240 K - £360 K
Total Number of Properties Sold in 2017
| Postcode |
Detached |
Semi-Detached |
Terraced |
Flat |
| SW1A |
0 |
0 |
0 |
13 |
| SW1E |
0 |
0 |
0 |
21 |
| SW1H |
0 |
0 |
1 |
10 |
| SW1P |
0 |
0 |
5 |
250 |
| SW1V |
1 |
0 |
20 |
152 |
| SW1W |
0 |
0 |
29 |
208 |
| SW1X |
2 |
1 |
16 |
89 |
| SW1Y |
0 |
0 |
0 |
12 |
Total Number of Buy-To-Let Properties in 2017
The Table below gives in percentage, the total number of properties purchased as Buy-To-Let.
| Postcode |
Detached |
Semi-Detached |
Terraced |
Flat |
| SW1A |
0% |
0% |
0% |
31% |
| SW1E |
0% |
0% |
0% |
5% |
| SW1H |
0% |
0% |
100% |
0% |
| SW1P |
0% |
0% |
0% |
6% |
| SW1V |
0% |
0% |
15% |
13% |
| SW1W |
0% |
0% |
34% |
28% |
| SW1X |
0% |
100% |
19% |
29% |
| SW1Y |
0% |
0% |
0% |
42% |
*Buy-to-let consists of Buy-to-lets (where they can be identified by a Mortgage) ,transfers to non-private individuals, transfers under a power of sale/repossessions
Multi Year Property Trend Analysis By Postcode
Schools for Postcode Area SW
- London SW Postcode Area - SW1A, SW1E, SW1H, SW1P, SW1V, SW1W, SW1X, SW1Y School Details
- London SW Postcode Area - SW2, SW3, SW4, SW5, SW6, SW7, SW8, SW9 School Details
- London SW Postcode Area - SW10, SW11, SW12, SW13, SW14, SW15, SW16, SW17, SW18, SW19, SW20 School Details
Posts for Postcode Area SW
- London SW Postcode Area - SW2, SW3, SW4, SW5, SW6, SW7, SW8, SW9 Property Market 2016
- London SW Postcode Area - SW10, SW11, SW12, SW13, SW14, SW15, SW16, SW17, SW18, SW19, SW20 Property Market 2016
- All SW Postcodes Yearly & Trend Analysis Posts
All SW Postcodes Yearly & Trend Analysis Posts

Reference
SW Postcode Area As Per Wikipedia
ca2f84d0-f98d-4e73-8280-5a0ba315a38c|0|.0|27604f05-86ad-47ef-9e05-950bb762570c
Tags :