11. February 2018 20:49
/
VInsights Team
/
/
Comments (0)
Please click here for the updated version of this post
This Post covers
- Coverage Area of Postcode E1 to E9
- Total Values of Properties Sold in 2017
- Average Sales Price in 2017
- Median Sales Price in 2017
- Standard Deviation of Sales Price in 2017
- Total Number of Properties Sold in 2017
- Total Number of Buy-To-Let Properties in 2017
- Multi Year Property Trend Analysis
- Schools for Postcode Area E
- Posts for Postcode Area E
Coverage Area of Postcode E1 to E9
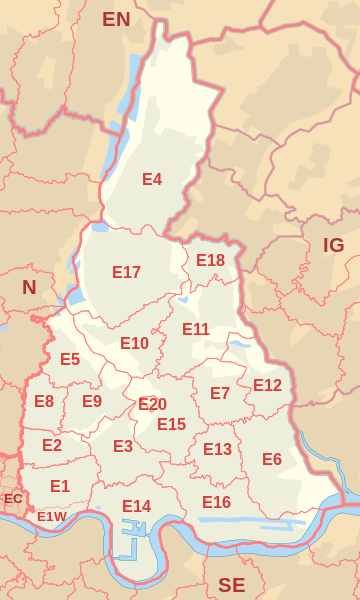 |
| Postcode |
Coverage Area |
Local Authority Area |
| E1 |
Eastern head district: Aldgate (part), Bishopsgate (part), Whitechapel, Shoreditch (part), Spitalfields, Shadwell, Stepney, Globe Town (part), Mile End (part), Portsoken, Brick Lane |
Tower Hamlets, Hackney, City of London |
| E1W |
Wapping |
Tower Hamlets |
| E2 |
Bethnal Green district: Bethnal Green, Haggerston, Hoxton, Shoreditch (part), Cambridge Heath, Globe Town (part) |
Tower Hamlets, Hackney |
| E3 |
Bow district: Bow, Bromley-by-Bow, Old Ford, Mile End, Fish Island, Bow Common, Poplar (part) Limehouse (part) Three Mills, London Gas Museum |
Tower Hamlets, Newham |
| E4 |
Chingford district: Chingford, Sewardstone, Highams Park, Upper Edmonton (part), Woodford Green (part) |
Waltham Forest, Enfield, Epping Forest |
| E5 |
Clapton district: Leyton (Part), Upper Clapton, Lower Clapton, Stoke Newington (part) |
Hackney,Waltham Forest |
| E6 |
East Ham district: East Ham, Beckton, Upton Park (part), Barking (part) |
Newham, Barking and Dagenham |
| E7 |
Forest Gate district: Forest Gate, Leytonstone (Part), Stratford (part) |
Newham, Waltham Forest |
| E8 |
Hackney district: Hackney Central, Dalston, London Fields, Stoke Newington (part) |
Hackney |
| E9 |
Homerton district: Homerton, Hackney Wick, South Hackney, Hackney Marshes, Victoria Park |
Hackney, Tower Hamlets |
Total Value of Properties Sold in 2017
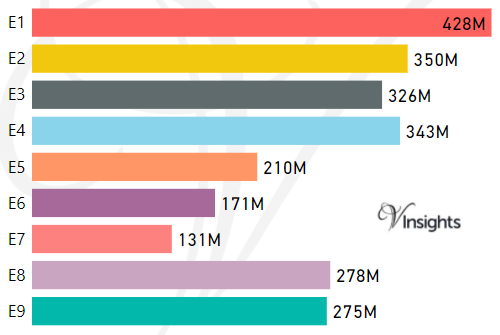
*M represents millions
*Total value includes Property Type Other apart from Detached, Semi-Detached, Terraced, Flat/Masionette
Average Sales Price in 2017
| Postcode |
Detached |
Semi-Detached |
Terraced |
Flat |
| E1 |
£2230K |
|
£1270K |
£561K |
| E1W |
£1895K |
£1110K |
£851K |
£812K |
| E2 |
|
£815K |
£870K |
£527K |
| E3 |
£880K |
£1090K |
£889K |
£395K |
| E4 |
£915K |
£530K |
£453K |
£274K |
| E5 |
£0K |
£553K |
£987K |
£430K |
| E6 |
£490K |
£408K |
£376K |
£247K |
| E7 |
£831K |
£671K |
£481K |
£289K |
| E8 |
£3000K |
£1624K |
£1095K |
£481K |
| E9 |
£2230K |
£799K |
£877K |
£430K |
Median Sales Price in 2017
| Postcode |
Detached |
Semi-Detached |
Terraced |
Flat |
| E1 |
£2230K |
|
£850K |
£510K |
| E1W |
£1895K |
£1109K |
£755K |
£745K |
| E2 |
|
£815K |
£850K |
£535K |
| E3 |
£880K |
£910K |
£860K |
£410K |
| E4 |
£780K |
£495K |
£450K |
£280K |
| E5 |
£0K |
£520K |
£950K |
£415K |
| E6 |
£470K |
£409K |
£375K |
£250K |
| E7 |
£955K |
£595K |
£458K |
£290K |
| E8 |
£3000K |
£1900K |
£1040K |
£475K |
| E9 |
£2140K |
£690K |
£805K |
£400K |
Standard Deviation of Sales Price in 2017
| Postcode |
Detached |
SemiDetached |
Terraced |
Flat |
| E1 |
|
|
£930K |
£255K |
| E1W |
|
|
£467K |
£473K |
| E2 |
|
|
£171K |
£172K |
| E3 |
|
£382K |
£338K |
£142K |
| E4 |
£449K |
£151K |
£101K |
£83K |
| E5 |
£0K |
£46K |
£301K |
£151K |
| E6 |
£28K |
£92K |
£79K |
£93K |
| E7 |
£344K |
£337K |
£148K |
£79K |
| E8 |
£0K |
£684K |
£430K |
£222K |
| E9 |
£383K |
£182K |
£362K |
£165K |
For example,
- Say the average detached property price for postcode XYZ is £300 K and ST. DEV. is £30 K.
- It means that most detached properties in postcode XYZ (about 68%) has price within one ST. Dev. i.e. the price range is £270K - £330K.
- All-most all detached property price (95%) in postcode XYZ lie between two ST. Dev. i.e. £240 K - £360 K
Total Number of Properties Sold in 2017
| Postcode |
Detached |
Semi-Detached |
Terraced |
Flat |
| E1 |
1 |
0 |
26 |
431 |
| E1W |
1 |
1 |
7 |
188 |
| E2 |
0 |
1 |
36 |
438 |
| E3 |
1 |
4 |
71 |
529 |
| E4 |
25 |
180 |
309 |
219 |
| E5 |
0 |
2 |
110 |
196 |
| E6 |
4 |
17 |
295 |
135 |
| E7 |
5 |
15 |
162 |
86 |
| E8 |
1 |
9 |
45 |
325 |
| E9 |
3 |
7 |
64 |
231 |
Total Number of Buy-To-Let Properties in 2017
The Table below gives in percentage, the total number of properties purchased as Buy-To-Let.
| Postcode |
Detached |
Semi-Detached |
Terraced |
Flat |
| E1 |
100% |
0% |
27% |
15% |
| E1W |
0% |
100% |
14% |
19% |
| E2 |
0% |
100% |
8% |
18% |
| E3 |
0% |
50% |
11% |
15% |
| E4 |
0% |
7% |
8% |
10% |
| E5 |
0% |
0% |
18% |
12% |
| E6 |
0% |
18% |
20% |
25% |
| E7 |
60% |
27% |
20% |
23% |
| E8 |
0% |
0% |
4% |
12% |
| E9 |
0% |
0% |
13% |
7% |
*Buy-to-let consists of Buy-to-lets (where they can be identified by a Mortgage) ,transfers to non-private individuals, transfers under a power of sale/repossessions
Multi Year Property Trend Analysis By Postcode
Schools for Postcode Area E
- London E Postcode Area - E1, E1W, E2, E3, E4, E5, E6, E7, E8, E9 School Details
- London E Postcode Area - E10, E11, E12, E13, E14, E15, E16, E17, E18, E20 School Details
Posts for Postcode Area E
All E Postcodes Yearly & Trend Analysis Posts

Reference
E Postcode Area As Per Wikipedia
711bfa56-3f04-4135-a0f0-e3db4ec5b165|0|.0|27604f05-86ad-47ef-9e05-950bb762570c
Tags :