Story Highlights
- Runnymede had total property sales of £684 millions in 2016
- The total number of properties sold in 2016 was 1401
- The average sales price was £488 K, whereas the median was £380 K
- New Property sales were 4.78% by value, whereas Not New Property contributed 95.22%
- Stamp duty changes caused monthly spike in March
- Brexit coupled with Stamp Duty changes had negative impact, causing decline of 7.3% over 2015
Runnymede is one of the districts of Surrey.
Total Sales By Property Type
Runnymede had total property sales of £684 millions which was % of the total Surrey Property Market 2016
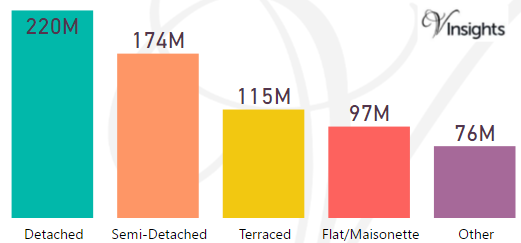
The split of £684 millions across the different property types are:
- Detached £220 millions (32.21%)
- Semi-Detached £174 millions (25.52%)
- Terraced £115 millions (16.86%)
- Flat/Maisonette £97 millions (14.22%)
- Other £76 millions (11.19%)
Runnymede Property Market at Postcode Level
| Postcode |
Coverage Area |
School |
Local Authority Area |
| GU25 |
Virginia Water, Wentworth |
Details |
Runnymede |
| KT13 |
Weybridge, Oatlands, Saint George's Hill, Hamm Court |
Details |
Elmbridge, Runnymede |
| KT14 |
Byfleet, West Byfleet |
Details |
Woking, Elmbridge, Runnymede |
| KT15 |
Addlestone, New Haw, Woodham |
Details |
Runnymede, Woking |
| KT16 |
Chertsey, Ottershaw, Longcross, Lyne, Dumsey Meadow in Littleton |
Details |
Runnymede, Spelthorne |
| TW18 |
Staines-upon-Thames, Egham Hythe, Laleham |
Details |
Runnymede, Spelthorne, Windsor and Maidenhead |
| TW20 |
Egham, Englefield Green, Thorpe |
Details |
Runnymede |
Month-wise Break-up of Total Sales
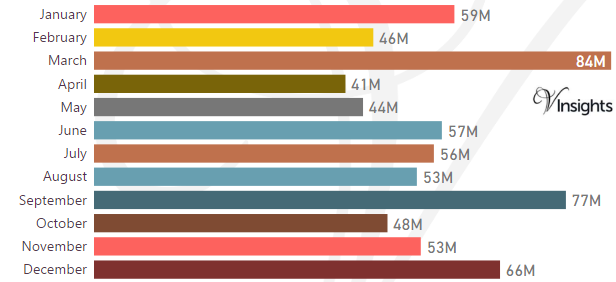
Some of the insights based on the £684 millions month-wise break-down :
Stamp Duty Hike Impact
- March had property sale spike of £84 millions compared to £46 millions in Feb and then sales sharply drop
- The impetus for it was to avoid the extra 3% in Stamp Duty Tax applicable on buying an additional home, being applicable from April 1 2016
Brexit Impact
- Brexit took place on 23rd June 2016.
- Year on Year decline has been 7.3% in 2016 over 2015
- Brexit coupled with Stamp Duty Hike had negative impact on Runnymede Property Market in 2016
Total No Of Properties Sold By Property Type
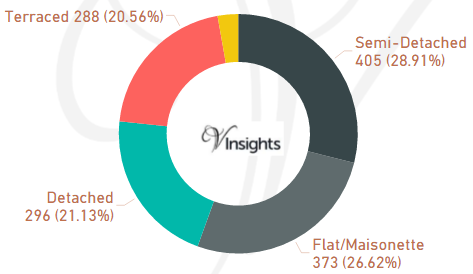
Runnymede had total property sales of 1401. The split across the different property types are:
- Semi-Detached 405 (28.91%)
- Flat/Maisonette 373 (26.62%)
- Detached 296 (21.13%)
- Terraced 288 (20.56%)
- Other 39(2.78%)
Average & Median Sales Price
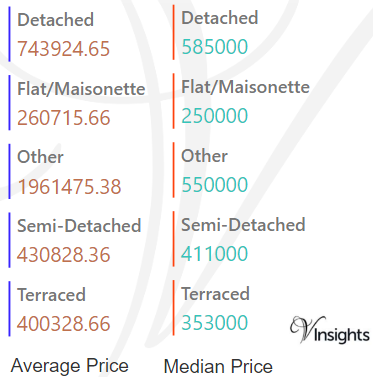
The average sales price in Runnymede was £488 K and for different property types it was:
- Detached £744 K
- Semi-Detached £431 K
- Terraced £400 K
- Flat/Maisonette £261 K
- Other it is £ 1.96 millions
Similarly median sales price in Runnymede was £380 K and for different property types are:
- Detached £585 K
- Semi-Detached £411 K
- Terraced £353 K
- Flat/Maisonette £250 K
- Other it is £550 K
New Vs Not New Property Statistics
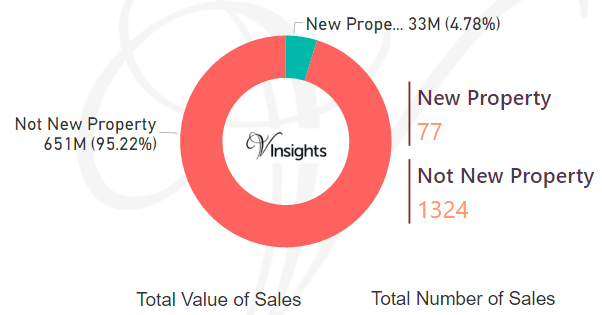
By Sales Value the split is as follows:
- New Property contributed £33 millions (4.78%)
- Not New Property contributed £651 millions (95.22%)
By Total Number the split is as follows:
- New properties sold were 77 (5.5%)
- Not new property sold were 1,324 (94.5%)
All Surrey Posts

e34f1de6-b7f4-4415-8ed3-413bc953305a|0|.0|27604f05-86ad-47ef-9e05-950bb762570c