Story Highlights
- Ealing had total Property Sales of £2.18 billions in 2016
- The total number of properties sold in year 2016 was 3,424
- The Average property price was £636 K in Ealing, while Median was £446 K
- The sales value contributed by New Property was 5.57%, whereas Not New Property 94.43%
- Stamp duty changes caused monthly spike in March
- Brexit coupled with Stamp Duty changes caused decline of 7% in total sales compared to 2015
Ealing is one of the Boroughs of West London. It had total Property Sales of £2.18 billions which was 15.51% of West London Property Market 2016.
Total Sales By Property Type
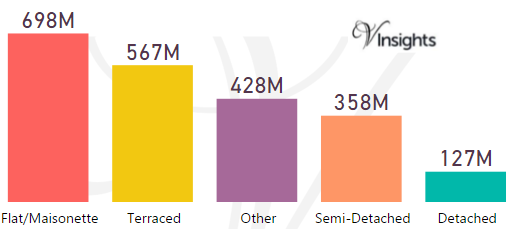
The split of £2.18 billions across the different property types are:
- Flat/Maisonette: £698 millions (32.04%)
- Terraced: £567 millions (26.03%)
- Other: £428 millions (19.66%)
- Semi-Detached: £358 millions (16.45%)
- Detached: £127 millions (5.83%)
Year on Year Comparison : Compared to Ealing Property Market 2015 in 2016
- All the property types have shown decline in sales except Other, Detached
- Others has shown growth of 35.44% in the total sales value
- Year on Year the property market for Ealing has declined by 7.23% over 2015
Ealing Property Market at Postcode level
| Postcode |
Coverage Area
|
Local Authority Area |
| HA0 |
Alperton, Sudbury, Sudbury Hill, Wembley Central and North Wembley
|
Brent, Harrow, Ealing |
| NW10 |
Willesden district: Willesden, Harlesden, Kensal Green, Brent Park, College Park, Stonebridge, North Acton (part), West Twyford, Neasden (south), Old Oak Common, Park Royal (north) |
Brent, Ealing, Hammersmith and Fulham, Kensington and Chelsea |
| TW8 |
Brentford, Kew Bridge, Syon Park |
Hounslow, Ealing |
| UB1 |
Southall (north) |
Ealing |
| UB2 |
Southall (south), Norwood Green |
Ealing, Hounslow |
| UB5 |
Northolt |
Ealing, Harrow, Hillingdon |
| UB6 |
Greenford, Perivale |
Ealing |
| W3 |
Acton, West Acton, North Acton (part), South Acton, East Acton (west), Park Royal (south), Hanger Hill Garden Estate, Gunnersbury Park |
Ealing, Hounslow, Hammersmith and Fulham |
| W4 |
Chiswick, Gunnersbury, Turnham Green, Acton Green, South Acton (part), Bedford Park |
Hounslow, Ealing, Hammersmith and Fulham |
| W5 |
Ealing, South Ealing, Ealing Common, North Ealing, Northfields, (south and east), Pitshanger, Hanger Lane |
Ealing, Hounslow |
| W7 |
Hanwell, Boston Manor (part) |
Ealing, Hounslow |
| W12 |
Shepherds Bush, White City, Wormwood Scrubs, East Acton (east) |
Hammersmith and Fulham, Ealing |
| W13 |
West Ealing, Northfields (north and west) |
Ealing |
For property market details at post code level please click on Postcode in the table above.
Month-wise Break-up of Total Sales
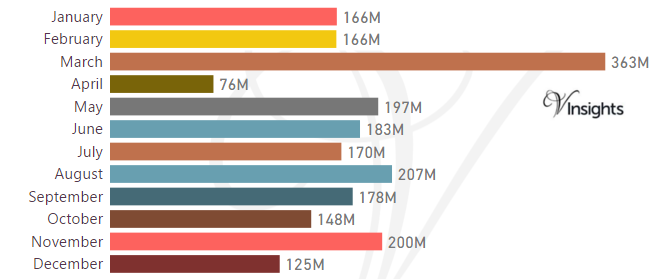
Stamp Duty Hike Impact
- March had property sale spike of £363 millions compared to £166 millions in Feb
- The impetus for it was to avoid the extra 3% in Stamp Duty Tax applicable on buying an additional home, being applicable from April 1 2016
Brexit Impact
- Brexit took place on 23rd June 2016.
- As can be observed from the month-wise break-up there does not seem to have been dip in the property sales in the immediate aftermath of Brexit
- Year on Year the property market for Ealing has declined by 7.23% over 2015
Total No Of Properties Sold By Property Type
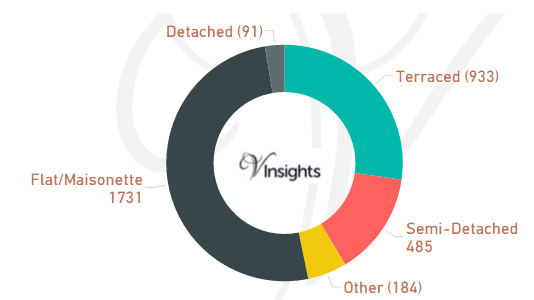
The total number of properties sold in Ealing 2016 was 3,424
- Terraced 933 (27.25%)
- Semi-Detached 485 (14.16%)
- Other 184 (5.37%)
- Flat/Maisonette 1,731 (50.55%)
- Detached 91 (2.66%)
Year on Year Comparison : Compared to Ealing Property Market 2015 in 2016
- Total number of property sales in London has declined by 15%
- All property types have shown decline in number of properties sold except property type Other
- Other has shown significant increase of 48.4% over 2015
Average & Median Sales Price
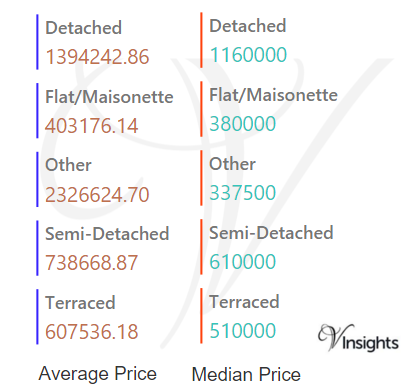
In 2016 the average property price was £636 K in Ealing. The average property price for the different property types are:
- Detached: £1.39 millions
- Flat/Maisonette: £403 K
- Other: £2.3 millions
- Semi-Detached: £739 K
- Terraced: £608 K
The median property price was £446 K. The median property price for the different property types are:
- Detached: £1.16 millions
- Flat/Maisonette: £380 K
- Other: £338 K
- Semi-Detached: £610 K
- Terraced: £510 K
Year on Year Comparison : Compared to Ealing Property Market 2015 in 2016
- The sales price across all property types have gone up except for Flat/Maisonette, Other
New Vs Not New Property Statistics
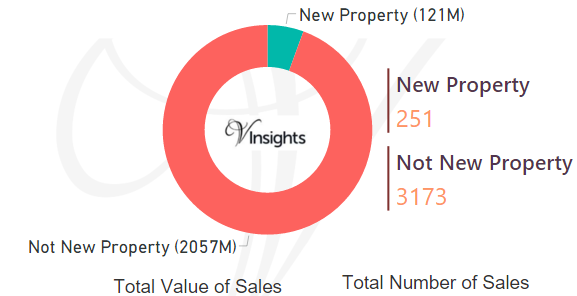
By Value Of Sales
- The sales value contributed by New Property was £121 millions (5.57%)
- Not New Property contributed £2.06 billions (94.43%)
By Number Of Sales
- New properties sold were 251 (7.33%)
- where as not new property sold were 3,173 (92.67%)
All London Posts
6b2ef156-221c-4d73-9fe5-c241e96ca0da|0|.0|27604f05-86ad-47ef-9e05-950bb762570c