Story Highlights
- Camden in 2016 had total property sales of £3.5 billions
- The total number of property sold in Camden 2016 was 2525
- The average sales price in Camden was £1.38 millions and the median sales price was £715 K
- The sales value contributed by New Property was 5.63% where as Not New Property contributed 94.37%
- Stamp duty caused monthly spike in March
- Brexit coupled with Stamp duty changes caused total sales to decline by 9.8% in 2016
Total Sales By Property Type
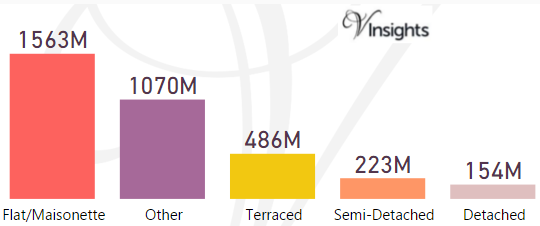
Camden is one of the Boroughs of Central London. It had total Property Sales of £3.5 billions which was 14.16% of Central London Property Market 2016.
The split across the different property types are:
- Terraced £486 millions (13.9%)
- Semi-Detached £223 millions (6.37%)
- Other £1.07 billion (30.6%)
- Flat/Maisonette £1.56 billions (44.71%)
- Detached £154 millions (4.42%)
Year on Year Comparison : Compared to Camden Property Market 2015 in 2016
- Camden had property sales decrease of £0.38 billions i.e. 9.8%
- Terraced, Flat/Maisonette, Detached had decrease in total property sales
- Semi-Detached, Other had increase in total property sales
Camden Property Market at Postcode level
| Postcode |
Coverage Area
|
Local Authority Area |
| ECIM |
Clerkenwell, Farringdon |
Islington, Camden, City of London |
| EC1N |
Hatton Garden |
Camden, City of London |
| EC1R |
Finsbury, Finsbury Estate (west) |
Islington, Camden |
| N1C |
Kings Cross Central |
Camden |
| N6 |
Highgate, Hampstead Heath (part) |
Camden, Haringey, Islington |
| N7 |
Holloway, Barnsbury (part), Islington (part), Tufnell Park (part) |
Islington, Camden |
| N19 |
Upper Holloway, Archway, Tufnell Park (part) |
Islington, Camden |
| NW1 |
North Western head district: Marylebone (part), Euston, Regent's Park, Baker Street, Camden Town, Somers Town, Primrose Hill (part) and Lisson Grove (part) |
Camden, Westminster |
| NW2 |
Cricklewood district: Cricklewood, Dollis Hill, Childs Hill, Golders Green (part), Brent Cross (part), Willesden (north), Neasden (north) |
Barnet, Brent, Camden |
| NW3 |
Hampstead district: Hampstead, Belsize Park, Frognal, Childs Hill (east), South Hampstead (north), Swiss Cottage (east), Primrose Hill (north), Chalk Farm (west), Gospel Oak |
Camden, Barnet |
| NW5 |
Kentish Town district: Kentish Town, Camden Town (part), Gospel Oak (part), Dartmouth Park, Chalk Farm (east), Tufnell Park (west) |
Camden, Islington |
| NW6 |
Kilburn district: Kilburn, Brondesbury, West Hampstead, Queen's Park, Kensal Green (part), South Hampstead (south), Swiss Cottage (west) |
Brent, Camden, Westminster |
| NW8 |
St John's Wood district: St John's Wood, Primrose Hill (south), Lisson Grove (north) |
Westminster, Camden |
| W1T |
Fitzrovia, Tottenham Court Road |
Camden |
| WC1A |
New Oxford Street |
Camden |
| WC1B |
Bloomsbury, British Museum, Southampton Row |
Camden |
| WC1E |
University College London |
Camden |
| WC1H |
St Pancras |
Camden |
| WC1N |
Russell Square, Great Ormond Street |
Camden |
| WC1R |
Gray's Inn |
Camden |
| WC1V |
High Holborn |
Camden, City of London |
| WC1X |
Kings Cross, Finsbury (west), Clerkenwell (north) |
Camden, Islington |
| WC2A |
Lincoln's Inn Fields, Royal Courts of Justice, Chancery Lane |
Camden, Westminster, City of London |
| WC2B |
Drury Lane, Kingsway, Aldwych |
Camden, Westminster |
| WC2H |
Leicester Square, St. Giles |
Camden, Westminster |
For property market details at post code level please click on Postcode in the table above.
Month-wise Break-up of Total Sales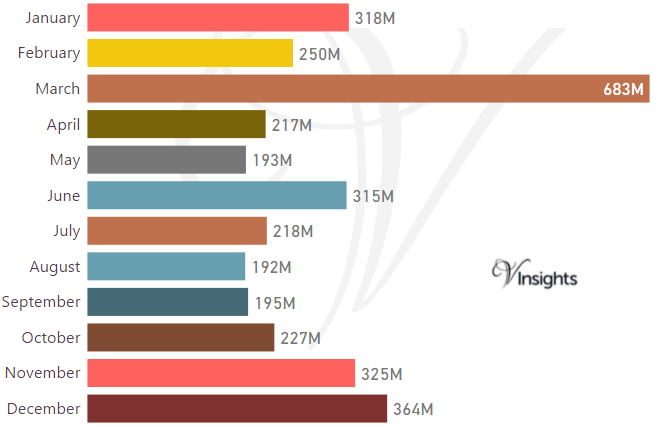
Some of the insights based on the £3.5 billions month-wise break-down :
Stamp Duty Hike Impact
- March had property sale spike of £683 millions compared to £250 millions in Feb
- The impetus for it was to avoid the extra 3% in Stamp Duty Tax applicable on buying an additional home, being applicable from April 1 2016
Brexit Impact
- Brexit took place on 23rd June 2016.
- As can be observed from the month-wise break-up there does seem to have been some dip in property sales in the immediate aftermath of Brexit
- Year on Year the property market for Camden has shown a decline of 9.8% over 2015
Total No Of Properties Sold By Property Type
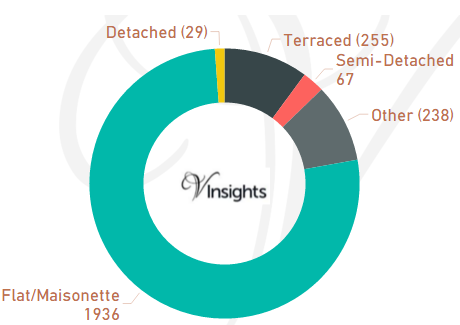
In Camden the total number of properties sold in year 2016 was 2525. The breakdown by different property types are:
- Terraced 255 (10.1%)
- Semi-Detached 67 (2.65%)
- Other 238 (9.43%)
- Flat/Maisonette 1936 (76.67%)
- Detached 29 (1.15%)
Year on Year Comparison : Compared to Camden Property Market 2015 in 2016
- Total sales volume has declined by 12.4%
- All the property type except Other had lower sales volume compared to 2015
- Other had sales volume growth of 60.8%
Average & Median Sales Price
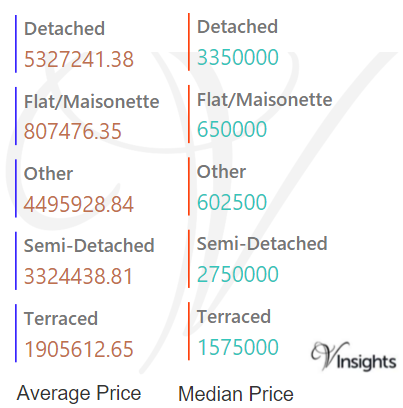
In 2016 the Average property price was £1.38 millions in Camden. The average price for the different property types are:
- Detached £5.33 millions
- Flat/Maisonette £808 K
- Other £4.5 millions
- Semi-Detached £3.3 millions
- Terraced £1.91 millions
The Median Price was £715 K. The median property price for the different property types are:
- Detached £3.35 millions
- Flat/Maisonette £650 K
- Other £603 K
- Semi-Detached £2.75 millions
- Terraced £1.6 millions.
Year on Year Comparison : Compared to Camden Property Market 2015 in 2016
- All property types have had increase in average and median sales price except for Other, Flat/Maisonette
New Vs Not New Property Statistics
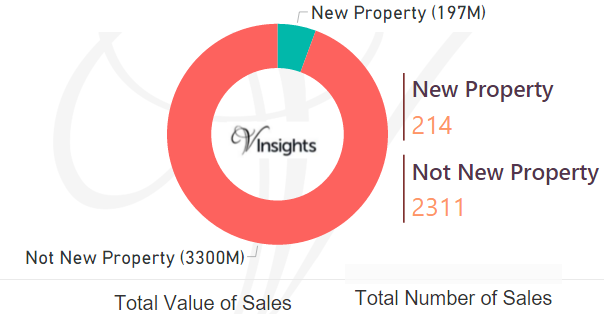
By Value Of Sales
- The sales value contributed by New Property was £197 millions (5.63%)
- Not New Property contributed £3.3 billions (94.37%)
By Number Of Sales
- New properties sold were 214 (8.48%)
- Not new property sold were 2311 (91.52%)
Year on Year Comparison : Compared to Camden Property Market 2015 in 2016
- New property market share in property market has gone down in 2016 over 2015
All London Posts
720cbeb8-044c-4ad7-ac80-cce7ac52ed1b|0|.0|27604f05-86ad-47ef-9e05-950bb762570c