Story Highlights
- Bromley had total Property Sales of £2.67 billions in 2016
- The total number of properties sold in year 2016 was 5,380
- The Average property price was £496 K in Bromley, while Median was £415 K.
- Not New Property contributed 95.7% and New Property 4.3% by value
- Stamp duty changes caused monthly spike in March
- Brexit coupled with Stamp Duty played significant role in total sales value decline of 8.5% compared to 2015
Bromley is one of the Boroughs of South London. It had total Property Sales of £2.67 billions which was 18.72% of South London Property Market 2016.
Total Sales By Property Type
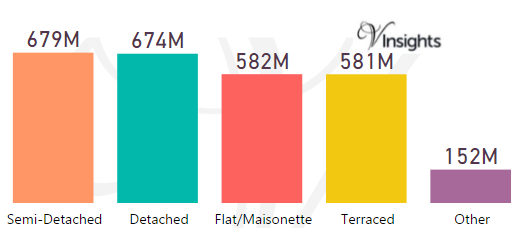
The split of £2.67 billions across the different property types are:
- Semi-Detached £679 millions (25.44%)
- Detached £674 millions (25.26%)
- Flat/Maisonette £582 millions (21.8%)
- Terraced £581 millions (21.79%)
- Other £152 millions (5.71%)
Year on Year Comparison : Compared to Bromley Property Market 2015 in 2016
- All the property types have shown decline in sales value
Bromely Property Market at Postcode Level
| Postcode |
Coverage Area
|
Local Authority Area |
| BR1 |
Bromley, Bickley, Downham, Sundridge
|
Bromley, Lewisham |
| BR2 |
Hayes, Shortlands, Bickley, Bromley Common, Keston |
Bromley |
| BR3 |
Beckenham, Elmers End, Shortlands, Eden Park, Park Langley |
Bromley, Lewisham, Croydon |
| BR4 |
West Wickham |
Bromley |
| BR5 |
Petts Wood, St Mary Cray, St Paul's Cray, Ruxley |
Bromley |
| BR6 |
Orpington, Locksbottom, Farnborough, Green Street Green, Chelsfield, Downe, Pratt's Bottom, Well Hill |
Bromley, Bexley, Sevenoaks |
| BR7 |
Chislehurst, Elmstead |
Bromley, Greenwich |
| BR8 |
Swanley, Hextable, Crockenhill, Swanley Village |
Sevenoaks, Bromley, Dartford |
| DA14 |
Sidcup, Foots Cray, North Cray, Longlands, Ruxley, part of Albany Park |
Bexley, Bromley |
| SE9 |
Eltham, Mottingham, New Eltham, Avery Hill (part), Falconwood (part), Sidcup (part), Chinbrook (part), Longlands (part) Kidbrooke (part), Shooter's Hill (part) |
Bexley, Bromley, Greenwich, Lewisham |
| SE19 |
Upper Norwood, Crystal Palace |
Bromley, Croydon, Lambeth, Lewisham, Southwark |
| SE20 |
Anerley, Crystal Palace (part), Penge, Beckenham (part) |
Bromley |
| SE26 |
Sydenham, Crystal Palace (part) |
Bromley, Lewisham, Southwark,Bexley |
| TN14 |
Cudham, Otford |
Bromley, Sevenoaks |
| TN16 |
Westerham, Biggin Hill, Tatsfield |
Sevenoaks, Bromley, Tandridge |
Month-wise Break-up of Total Sales
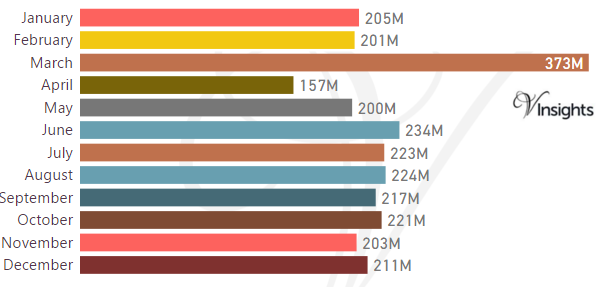
Stamp Duty Hike Impact
- March had property sale spike of £373 millions compared to £201 millions in Feb
- The impetus for it was to avoid the extra 3% in Stamp Duty Tax applicable on buying an additional home, being applicable from April 1 2016
Brexit Impact
- Brexit took place on 23rd June 2016.
- Year on Year the property market for Bromley has shown a decline of 8.5% over 2015
Total No Of Properties Sold By Property Type
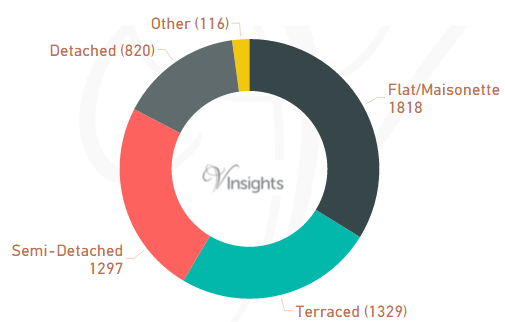
In Bromley the total number of properties sold in year 2016 was 5,380.
The breakdown by different property types are:
- Terraced 1,329 (24.7%)
- Semi-Detached 1,297 (24.11%)
- Other 116 (2.16%)
- Flat/Maisonette 1,818 (33.79%)
- Detached 820 (15.24%).
Year on Year Comparison : Compared to Bromley Property Market 2015 in 2016
- Total number of property sales in Bromley has declined by 15.5%
- All property types have shown decline in number of properties sold except property type Other
- Other has shown significant increase of 54.5%
Average & Median Sales Price
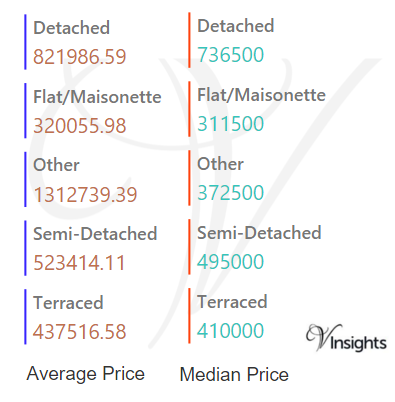
In 2016 the Average property price was £496 K in Bromley. The average price for the different property types are:
- Detached £822 K
- Flat/Maisonette £320 K
- Other £1.31 millions
- Semi-Detached £523 K
- Terraced £438 K
The Median Price was £415 K.The median property price for the different property types are
- Detached £737 K
- Flat/Maisonette £312 K
- Other £373 K
- Semi-Detached £495 K
- Terraced £410 K
Year on Year Comparison : Compared to Bromley Property Market 2015
- The average and median sales price across all property types have gone up except for others
- Others have shown decline in average and median sales price
New Vs Not New Property Statistics
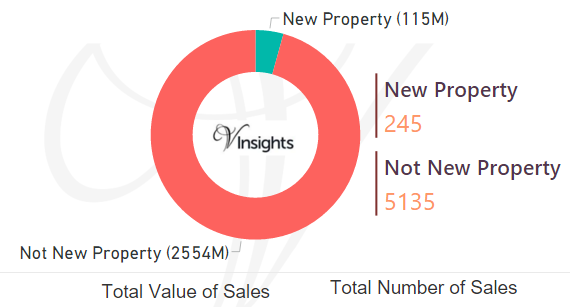
By Value Of Sales
- Not New Property contributed £2.55 billions (95.7%)
- New Property £115 millions (4.3%)
By Number Of Sales
- The number of Not New Property sold was 5,135 (95.45%)
- The number of New Property sold was 245 (4.55%)
Year on Year Comparison : Compared to Bromley Property Market 2015 in 2016
- New property market share in property market has gone down in 2016 over 2015
All London Posts
8b62357e-f981-447b-bc77-cf22a6a662ed|0|.0|27604f05-86ad-47ef-9e05-950bb762570c