
Story Highlights
- South East England had total property sales of £62 Billions in 2016
- Total Sales By county was maximum in Surrey at £10.73 Billions
- The total number of properties sold in 2016 was 164,115 properties
- The average sales price in South East England was £377 K, whereas median was £291 K
- The average sales price in South East England at County level was maximum for Surrey at £527 K
- New Property sales were 8.37% by value, whereas Not New Property contributed 91.63%
- Stamp duty hike caused monthly spike in March
- Brexit coupled with Stamp Duty Hike arrested the sharp growth in South East England property market in 2016, there was modest growth of 1.63%
South East is one of the 9 principal areas of England. South East England counties are Berkshire, Buckinghamshire, Milton Keynes, East Sussex, Brighton & Hove,Hampshire, Southampton, Portsmouth, Isle Of Wight, Kent, Medway, Oxfordshire, Surrey, West Sussex. It is the most populous of the nine regions of England.
Total Sales By County
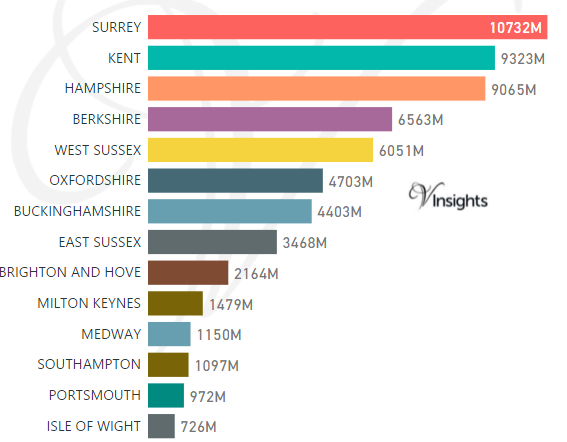
South East England had total property sales of £62 Billions. It contributed 20.82% of the England and Wales Property Market 2016
County wise split of South East England property market 2016 was :
Year on Year Comparison : Compared to South East England Property Market 2015 in 2016
- South East England property sales has shown growth of 1.63%
- Counties with growth over 2015 are Hampshire, Kent, West Sussex, Oxfordshire, East Sussex, Brighton and Hove, Southampton, Portsmouth, Isle Of Wight
- Counties with decline over 2015 are Surrey, Berkshire, Buckinghamshire, Medway
Total Value of Sales By Property Types
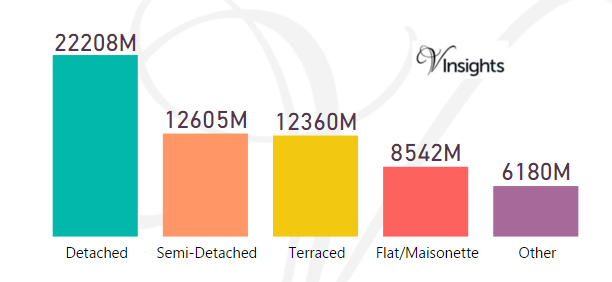
The split of £62 Billions across the different property types was
- Detached at £22.2 Billions (%)
- Terraced at £12.61 Billions (%)
- Semi-Detached at £12.36 Billions (%)
- Flat/Maisonette at £8.54 Billions (%)
- Other at £6.18 billions (%)
Year on Year Comparison : Compared to South East England Property Market 2015 in 2016
- All the property types sales have shown growth except Detached
Month-wise Break-up of Total Sales
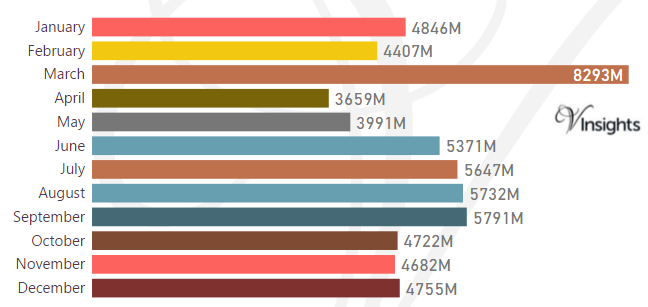
Some of the insights based on the £62 Billions month-wise break-down :
Stamp Duty Hike Impact
- March had property sale spike of £8.29 billions compared to £4.41 billions in Feb
- The impetus for it was to avoid the extra 3% in Stamp Duty Tax applicable on buying an additional home, being applicable from April 1 2016
Brexit Impact
- Brexit took place on 23rd June 2016.
- As can be observed from the month-wise break-up there does not seem to have been dip in property sales in the immediate aftermath of Brexit
- Year on Year growth has been 1.63%
- So Brexit has cooled the sharp growth in property market witnessed over the last couple of years
Total Number of Sales By Property Types
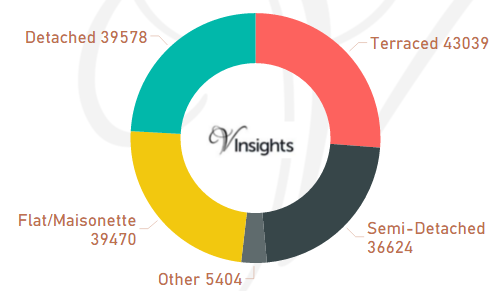
The total property sales of £62 Billions in 2016 was spread over 164,115 properties.
- Terraced properties at 43,039 (26.22%)
- Detached at 39,578 (24.12%)
- Semi-Detached at 36,624 (22.32%)
- Flat/Maisonette at 39,470 (24.05%)
- Others at 5,404 (3.29%)
Year on Year Comparison : Compared to Compared to South East England Property Market 2015 in 2016
- Total number of property sales in 2016 has decreased by 5.77%.
- All property types have shown decline in number of properties sold except property type Other.
- Other has shown significant increase of 98%
Average & Median Sales Price
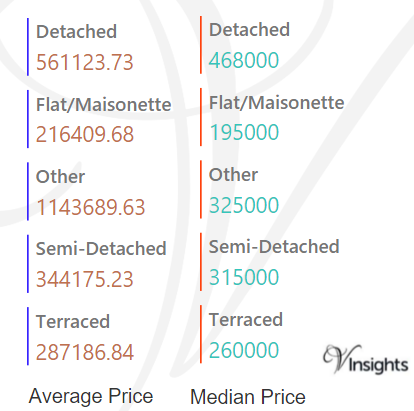
The average sales price in South East was £377 K. For the different property types it was
- Detached at £561 K
- Semi-Detached at £344 K
- Terraced at £287 K
- Flat/Maisonette at £216 K
- Other it is at £1.14 million.
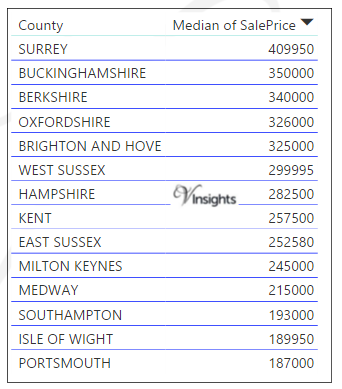
Similarly median sales price in South East was £291 K. For different property types it was
- Detached at £468 K
- Semi-Detached at £315 K
- Terraced at £260 K
- Flat/Maisonette at £195 K
- Other it is at £325 K
Year on Year Comparison : Compared to South East England Property Market 2015 in 2016
- The average and median property prices have gone up except for property type Other
- Other has had decline in average and median property price
Average & Median Sales Price By County
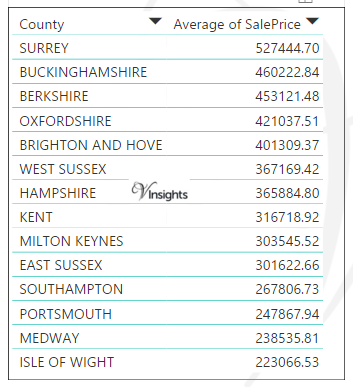
The average sales price in South East in 2016 is as above.
Year on Year Comparison : Compared to South East England Property Market 2015 in 2016
- The average and median sales price across all the counties have gone up
New Vs Not New Property Statistics
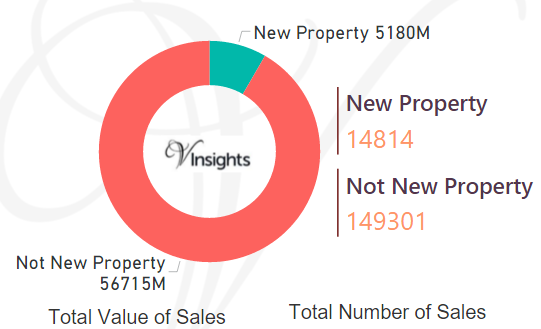
By Value Of Sales
- The sales value contributed by New Property was £5.18 billions (8.37%)
- where as Not New Property contribute £56.72 billions ( 91.63%)
By Number Of Sales
- New properties sold were 14,814 (9.03%)
- where as Not New Property sold were 149,301 (90.97%)
Year on Year Comparison : Compared to England and Wales Property Market 2015 in 2016
- New property market share in property market has gone down in 2016 over 2015
All England Posts

56470c23-cb92-4254-a4cf-70ce3adeeb50|1|5.0|27604f05-86ad-47ef-9e05-950bb762570c