
Story Highlights
- North London had total property sales of approx. £6.6 billions in 2016
- The maximum sales at borough level was in Barnet at £3.25 billions
- The total number of North London properties sold in 2016 was 11,760
- The average sales price in North London was £561 K, whereas median was £425 K
- By borough the average price was maximum in Haringey at £607 K
- New Property sales were 11.24% by value, whereas Not New Property contributed 88.76%
- Stamp duty changes caused monthly spike in March
- Brexit coupled with Stamp Duty changes caused total sales to decline by 5.7%
North London is the northern part of London. It comprises of Barnet, Enfield, Haringey
Total Sales By Borough
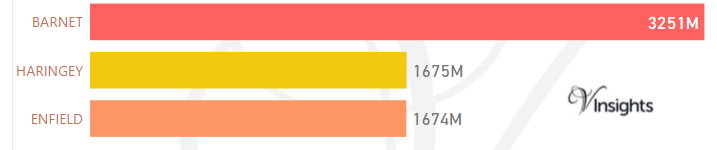
The total sales of £6.6 billions in 2016 was split across its borough as above. It is 8.68% of London Property Market 2016
Year on Year Comparison : Compared to North London Property Market 2015 in 2016
Total Value of Sales By Property Types
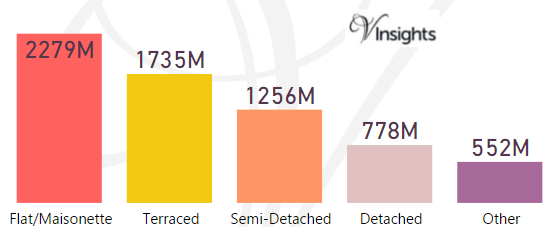
North London in 2016 had total property sales of £6.6 billions.The split across the different property types are:
- Detached £778 millions (11.79%)
- Semi-Detached £1.26 billions (19.03%)
- Terraced £ 1.74 billions (26.29%)
- Other £552 million (8.37%)
- Flat/Maisonette £2.28 billions (34.52%)
Year on Year Comparison : Compared to North London Property Market 2015 in 2016
- All the property types have shown decline in sales except Flat/Maisonette
- Flat/Maisonette has show very modest growth of 1.3% from £2.25 billions in 2015 to £2.28 billions in 2016
Month-wise Break-up of Total Sales
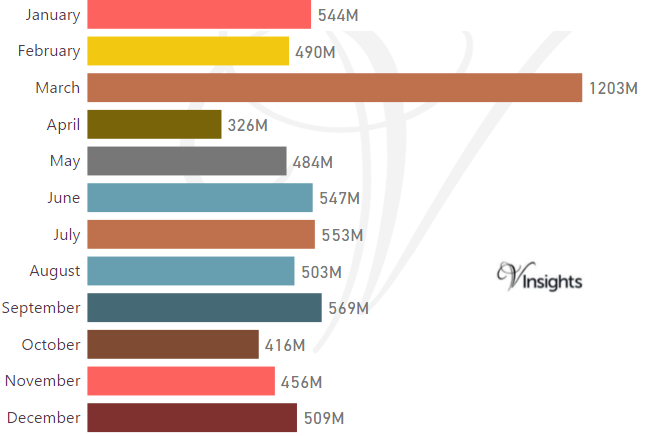
Stamp Duty Hike Impact
- March had property sale spike of £ 1.20 billions compared to £ 490 millions in Feb
- The impetus for it was to avoid the extra 3% in Stamp Duty Tax applicable on buying an additional home, being applicable from April 1 2016
Brexit Impact
- Brexit took place on 23rd June 2016.
- As can be observed from the month-wise break-up there does not seem to have been dip in property sales in the immediate aftermath of Brexit
- Year on Year the property market for North London has shown a decline of 5.71% over 2015
Total Number Of Sales By Property Types
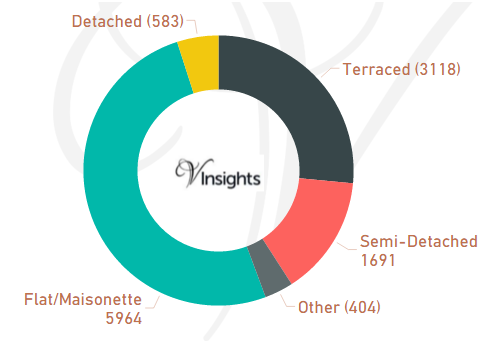
The total number of property sold in North London 2016 was 11,760. It is split as:
- Detached 583 (4.96%)
- Semi-Detached 1,691 (%)
- Terraced 3,118 (26.51%)
- Flat/Maisonette 5,964 (50.71%)
- Other 404 (3.44%)
Year on Year Comparison : Compared to North London Property Market 2015 in 2016
- Total number of property sales in North London has decreased by 1,065 which is 8.3% decline
- All property types have shown decline in number of properties sold except property type Other
- Other has shown significant increase of 69% from 239 in 2015 to 404 in 2016.
Average & Median Sales Price
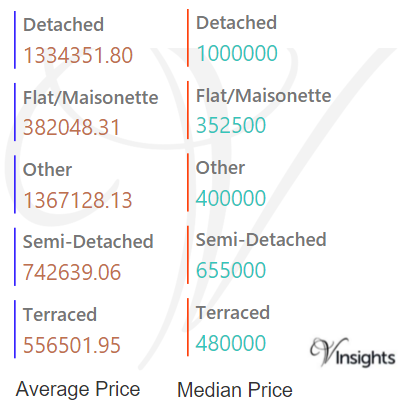
The average sales price in North London was £561 K. For the different property types it was:
- Detached: £1.33 millions
- Semi-Detached: £743 K
- Terraced: £557 K
- Flat/Maisonette: £382 K
- Other it is £1.37 millions.
Similarly the median sales price in North London was £425 K. For the different property types it was:
- Detached: £1 millions
- Semi-Detached: £655 K
- Terraced: £480 K
- Flat/Maisonette: £353 K
- Other it is £400 K
Year on Year Comparison : Compared to North London Property Market 2015
- The average and median sales price across all property types have gone up except for others
Average & Median Sales Price By Borough
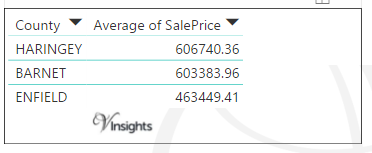
In North London the average of Sales Price is as above.
- The highest average sales prices is in Haringey at £607 K
- Barnet at £603 K,
- Enfield being minimum at £463 K
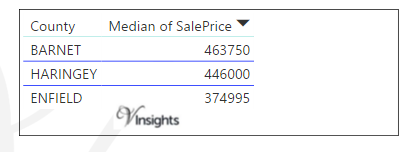
In North London the median of sales price is as above.
- The median sales prices was maximum in Barnet at £464 K
- Haringey at £446 K
- Enfield being minimum at £375 K
Year on Year Comparison : Compared to North London Property Market 2015 in 2016
- The average and median sales price across all the North London boroughs have gone up with Haringey leading the pack in average sales price and Barnet in median sales price.
New Vs Not New Property Statistics
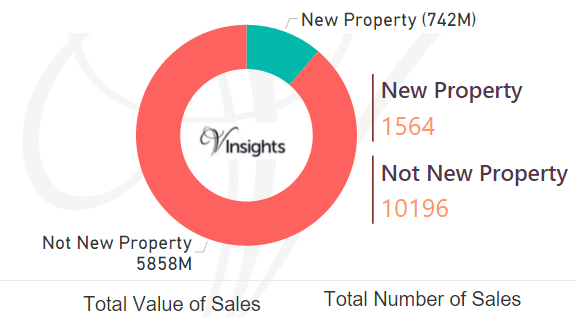
By Value Of Sales
- The sales value contributed by New Property was £742 millions (11.24%)
- Not New Property contributed £5.9 billions (88.76%).
By Number Of Sales
- New properties sold were 1,564 (13.3%)
- Not new property sold were 10,196 (86.7%)
Year on Year Comparison : Compared to North London Property Market 2015 in 2016
- New property market share in property market has gone up in 2016 over 2015
All London Posts 
eb90aa3e-5032-44c3-8819-705b373238c5|0|.0|27604f05-86ad-47ef-9e05-950bb762570c
Story Highlights
- Merton had total Property Sales of £1.74 billions in 2016
- The total number of properties sold in year 2016 was 2859
- The Average property price was £609 K in while median was £443 K
- Not New Property Contributed 96.23% and New Property 3.77% by sales value
- Stamp duty changes caused monthly spike in March
- Brexit coupled with Stamp Duty contribute to the 9.4% decline in total sales value
Merton is one of the Boroughs of South London. It had total Property Sales of £1.74 billions which was 12.22% of the South London Property Market 2016
Total Sales By Property Type
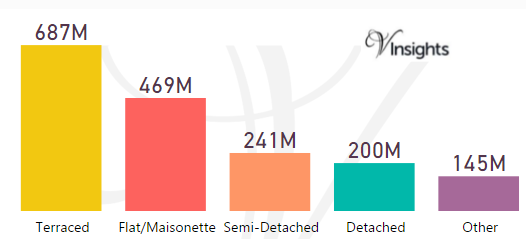
The split of £1.74 billions across the different property types are:
- Terraced £687 millions (39.44%)
- Flat/Maisonette £469 millions (26.9%)
- Semi-Detached £241 millions (13.86%)
- Detached £200 millions (11.46%)
- Other £145 millions (8.33%)
Year on Year Comparison : Compared to Merton Property Market 2015 in 2016
- All the property types have shown in sales except others.
- Others has shown growth of 2.84% in total sales value
Merton Property Market at Postcode Level
| Postcode |
Coverage Area
|
Local Authority Area |
| CR4 |
Mitcham, Mitcham Common, Pollards Hill, Eastfields, Beddington Corner
|
Merton, Sutton, Croydon |
| CR7 |
Thornton Heath, Broad Green (part)
|
Croydon, Merton |
| KT3 |
Croydon, Merton
|
Kingston Upon Thames, Merton |
| SM3 |
The western part of Sutton Common, North Cheam, Stonecot Hill
|
Sutton, Merton |
| SM4 |
Morden, Morden Park, Lower Morden, St. Helier (West), Rosehill
|
Merton, Sutton |
| SW14 |
Mortlake, East Sheen
|
Richmond Upon Thames, Merton |
| SW15 |
Kingston Vale, Putney, Putney Heath, Putney Vale, Richmond Park, Roehampton, Roehampton Vale
|
Kingston Upon Thames, Richmond Upon Thames, Wandsworth, Merton |
| SW16 |
Streatham, Streatham Common, Norbury, Thornton Heath, Streatham Park, Furzedown, Streatham Vale, Mitcham Common, Pollards Hill, Eastfields
|
Croydon, Lambeth, Merton, Wandsworth |
| SW17 |
Tooting, Mitcham (part) Balham (part)
|
Merton, Wandsworth |
| SW18 |
Wandsworth, Southfields, Earlsfield
|
Wandsworth, Merton |
| SW19 |
Wimbledon, Colliers Wood, Merton Park, Merton Abbey, Southfields, Morden (part)
|
Merton, Wandsworth |
| SW20 |
Raynes Park, Lower Morden, Merton Park, Wimbledon Chase
|
Merton, Kingston upon Thames |
For property market details at post code level please click on Postcode in the table above.
Month-wise Break-up of Total Sales
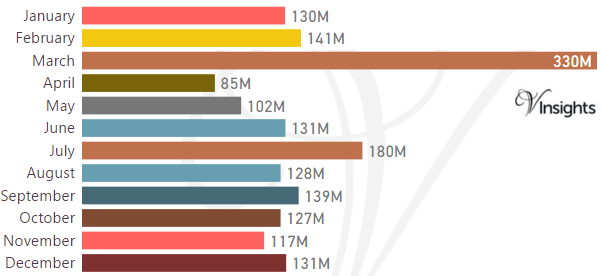
Stamp Duty Hike Impact
- March had property sale spike of £330 millions compared to £141 millions in Feb
- The impetus for it was to avoid the extra 3% in Stamp Duty Tax applicable on buying an additional home, being applicable from April 1 2016
Brexit Impact
- Brexit took place on 23rd June 2016.
- As can be observed from the month-wise break-up there does not seem to have been significant dip in property sales in the immediate aftermath of Brexit
- Year on Year the property market for Merton has shown a decline of 9.4% over 2015
Total No Of Properties Sold By Property Type
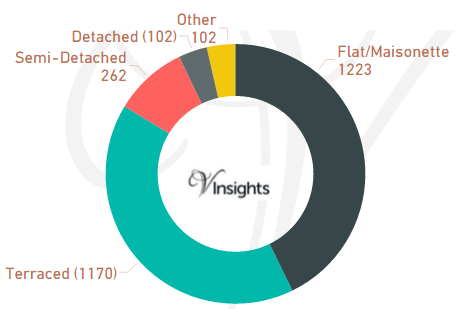
In Merton the total number of properties sold in year 2016 was 2859
The breakdown by different property types are:
- Terraced 1170 (40.92%)
- Semi-Detached 262 (9.16%)
- Other 102 (3.57%)
- Flat/Maisonette 1223 (42.78%)
- Detached 102 (3.57%)
Year on Year Comparison : Compared to Merton Property Market 2015 in 2016
- Total number of property sales in Merton has declined by 11.89%
- All property types have shown decline in number of properties sold except property type Other
- Other has shown significant increase of 24.4%
Average & Median Sales Price
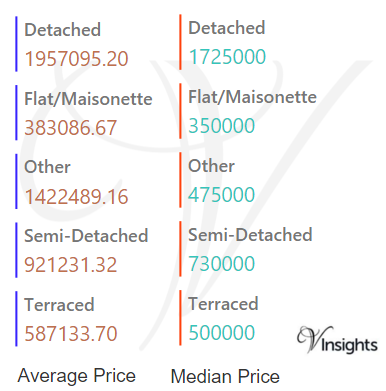
The average sales price in Merton was £609 K. For the different property types it was:
- Detached £1.96 millions
- Semi-Detached £921 K
- Terraced £587 K
- Flat/Maisonette £383 K
- Other it is £1.4 millions.
Similarly the median sales price in Merton was £443 K. For the different property types it was:
- Detached £1.73 millions
- Semi-Detached £730 K
- Terraced £500 K
- Flat/Maisonette £350 K
- Other it is £475 K
Year on Year Comparison : Compared to Merton Property Market 2015 in 2016
- Fpr Flat/Maisonette, Semi-Detached, Terraced the average and median sales price have gone up
- Others have shown sharp decline in average and median sales price
New Vs Not New Property Statistics
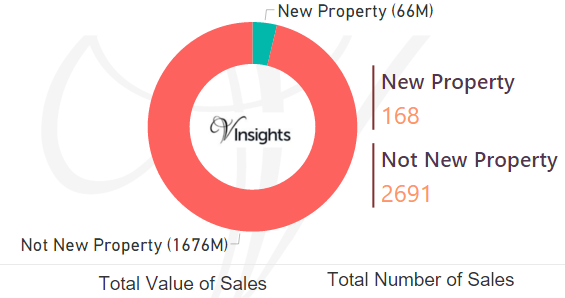
By Value Of Sales
- Not New Property contributed £1.7 billions (96.23%)
- New Property £66 millions (3.77%)
By Number Of Sales
- The number of Not New Property sold was 2691 (94.12%)
- The number of New Properties sold was 168 (5.88%)
Year on Year Comparison : Compared to Merton Property Market 2015 in 2016
- New property market share in property market has not shown noticeable difference in 2016 over 2015
All London Posts
2d4f3d7e-e2af-46b2-a7be-3aa0c050233a|0|.0|27604f05-86ad-47ef-9e05-950bb762570c
Story Highlights
- Kingston Upon Thames had total Property Sales of £1.4 billions in 2016
- The total number of properties sold in year 2016 was 2338
- The Average property price was £598 K in while median was £460 K
- New Property sales were 2.5% by value where as Not New Property contributed 97.5%
- Stamp duty changes caused monthly spike in March
- Brexit coupled with Stamp Duty changes caused significant decline of 13.3% (total sales by values) in Kingston Upon Thames property market 2016 over 2015
Kingston Upon Thames is one of the Boroughs of South London. It had total Property Sales of £1.4 billions which was 9.81% of South London Property Market 2016.
Total Sales By Property Type
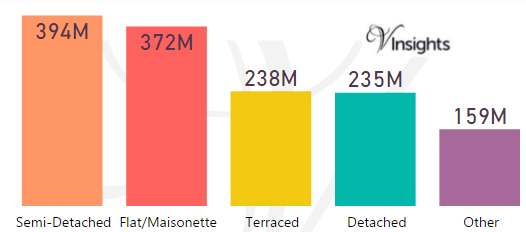
The split of £1.4 billions across the different property types are:
- Semi-Detached £394 millions (28.21%)
- Flat/Maisonette £372 millions (26.58%)
- Terraced £238 millions (17.01%)
- Detached £235 millions (16.8%)
- Other £159 millions (11.4%)
Year on Year Comparison : Compared to Kingston Upon Thames Property Market 2015 in 2016
- All the property types have shown decline in sales
- Year on Year the property market for Kingston Upon Thames has shown a decline of 14.3% over 2015
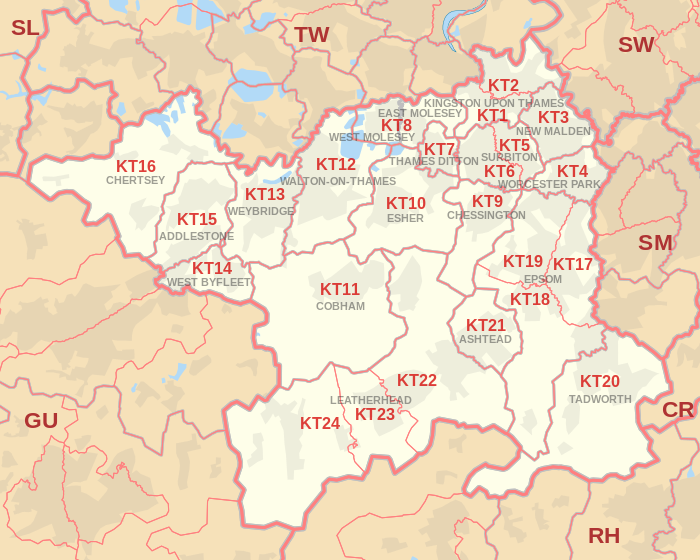
Kingston Upon Thames Property Market at Postcode Level
 |
| Postcode |
Coverage Area
|
Local Authority Area |
| KT1 |
Kingston upon Thames, Hampton Wick, Norbiton
|
Kingston upon Thames, Richmond upon Thames |
| KT2 |
Kingston Upon Thames, Canbury, Coombe |
Kingston upon Thames, Richmond upon Thames |
| KT3 |
New Malden, part of Old Malden |
Kingston upon Thames, Merton |
| KT4 |
Worcester Park, Cuddington, part of Old Malden, Stoneleigh |
Sutton, Epsom and Ewell, Kingston upon Thames |
| KT5 |
Surbiton, Berrylands, Tolworth |
Kingston upon Thames |
| KT6 |
Surbiton, Tolworth, Long Ditton |
Kingston upon Thames, Elmbridge |
| KT9 |
Chessington including Malden Rushett, Hook, part of Long Ditton |
Kingston upon Thames, Elmbridge |
| KT19 |
Epsom, West Ewell, Stoneleigh, Horton, Longmead |
Epsom and Ewell |
| SW15 |
Kingston Vale, Putney, Putney Heath, Putney Vale, Richmond Park, Roehampton, Roehampton Vale |
Kingston upon Thames, Richmond upon Thames, Wandsworth,Merton |
| SW20 |
Raynes Park, Lower Morden, Merton Park, Wimbledon Chase |
Merton, Kingston upon Thames |
For property market details at post code level please click on Postcode in the table above.
Month-wise Break-up of Total Sales
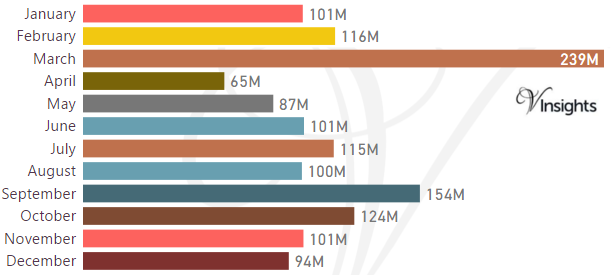
Stamp Duty Hike Impact
- March had property sale spike of £239 millions compared to £ 116 millions in Feb
- The impetus for it was to avoid the extra 3% in Stamp DutyTax applicable on buying an additional home, being applicable from April 1 2016
Brexit Impact
- Brexit took place on 23rd June 2016.
- As can be observed from the month-wise break-up there does not seem to have been significant dip in property sales in the immediate aftermath of Brexit
- Year on Year the property market for Kingston Upon Thames has shown a decline of 14.3% over 2015
Total No Of Properties Sold By Property Type
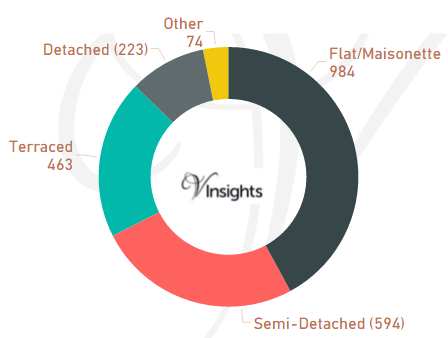
In Kingston Upon Thames the total number of properties sold in year 2016 was 2338
The breakdown by different property types are:
- Terraced 463 (19.8%)
- Semi-Detached 594 (25.41%)
- Other 74 (3.17%)
- Flat/Maisonette 984 (42.09%)
- Detached 223 (9.54%)
Year on Year Comparison : Compared to Kingston Upon Thames Property Market 2015 in 2016
- Total number of property sales in Kingston upon Thames has declined by 14.67%
- All property types have shown decline in number of properties sold except property type Other
- Other has shown significant increase of 29.8% over 2015.
Average & Median Sales Price
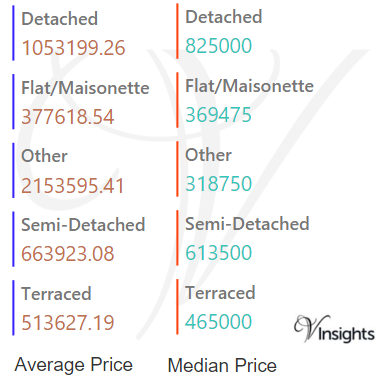
In 2016 the Average property price was £598 K in Kingston Upon Thames. The average price for the different property types are:
- Detached £1.05 million
- Flat/Maisonette £378 K
- Other £2.15 millions
- Semi-Detached £664 K
- Terraced £513 K
The Median Price was £460 K.The median property price for the different property types are:
- Detached £825 K
- Flat/Maisonette £370 K
- Other £319 K
- Semi-Detached £614 K
- Terraced £465 K
Year on Year Comparison : Compared to Kingston Upon Thames Property Market 2015
- The average and median sales price across all property types have gone up except for others
- Others have shown sharp decline in average and median sales price
New Vs Not New Property Statistics
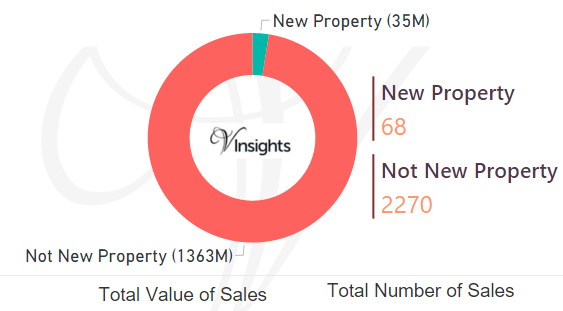
By Value Of Sales
- Not New Property contributed £1.36 billions (97.5%)
- New Property contributed £35 millions (2.5%)
By Number Of Sales
- The number of Not New Property sold was 2270 (97.09%)
- The number of New Property sold was 68 (2.91%)
Year on Year Comparison : Compared to Kingston Upon Thames Property Market 2015 in 2016
- New property market share in property market has gone down in 2016 over 2015
All London Posts
f2522704-da0e-4b80-b41b-741f34dd863f|0|.0|27604f05-86ad-47ef-9e05-950bb762570c
Story Highlights
- Croydon had total Property Sales of £2.24 billions in 2016
- The total number of properties sold in year 2016 was 5,696
- The Average property price was £393 K in Croydon, while Median was £332 K
- Not New Property contributed 92.18% and New Property 7.82% by sales value
- Stamp duty changes caused monthly spike in March
- Brexit coupled with Stamp Duty have played significant role in decline of 8.6% (total sales value)
Croydon is one of the Boroughs of South London. It had total Property Sales of £2.24 billions which was 15.69% of South London Property Market 2016.
Total Sales By Property Type
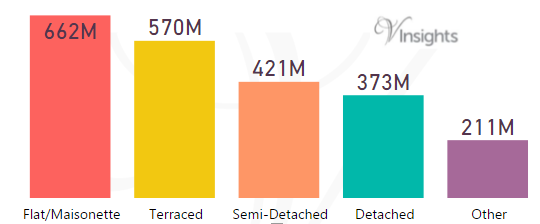
The split of of £2.24 billions across the different property types are:
- Flat/Maisonette £662 millions (29.59%)
- Terraced £570 millions (25.47%)
- Semi-Detached £421 millions (18.85%)
- Detached £373 millions (16.68%)
- Other £211 millions (9.42%)
Year on Year Comparison : Compared to Croydon Property Market 2015 in 2016
- All the property types have shown decline in sales except Terraced
- Terraced has shown a very nominal growth of 0.9% in total sales value
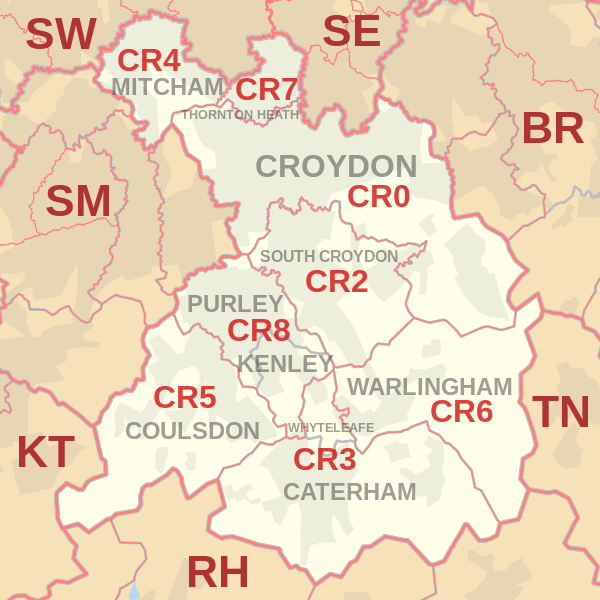
Croydon Property Market at Postcode Level
 |
| Postcode |
Coverage Area
|
Local Authority Area |
| CR0 |
Croydon, Addiscombe, Woodside (part), Selhurst, Broad Green, Spring Park, Shirley, Addington, New Addington, Coombe, Forestdale, Waddon, Beddington, Thornton Heath (part)
|
Croydon, Sutton |
| CR2 |
South Croydon, Sanderstead, Selsdon, part of Addington
|
Croydon |
| CR3 |
Caterham, Chaldon, Woldingham, Whyteleafe, Hamsey Green
|
Tandridge, Croydon |
| CR4 |
Mitcham, Mitcham Common, Pollards Hill, Eastfields, Beddington Corner
|
Merton, Sutton, Croydon |
| CR5 |
Coulsdon, Old Coulsdon, Chipstead, Hooley, Netherne-on-the-Hill, part of Woodmansterne, Clockhouse
|
Croydon, Reigate and Banstead, Sutton |
| CR6 |
Warlingham, parts of Chelsham and Farleigh, Hamsey Green
|
Tandridge, Croydon, Bromley |
| CR7 |
Thornton Heath, Broad Green (part)
|
Croydon, Merton |
| CR8 |
Purley, Kenley, Russell Hill
|
Croydon, Sutton, Tandridge |
| CR9 |
Shirley
|
Croydon |
| SE19 |
Upper Norwood, Crystal Palace
|
Bromley, Croydon, Lambeth, Lewisham, Southwark |
| SE25 |
South Norwood, Selhurst (part), Thornton Heath (part), Woodside (part)
|
Croydon |
| SW16 |
Streatham, Streatham Common, Norbury, Thornton Heath, Streatham Park, Furzedown, Streatham Vale, Mitcham Common, Pollards Hill, Eastfields
|
Croydon, Lambeth, Merton, Wandsworth |
For property market details at post code level please click on Postcode in the table above.
Month-wise Break-up of Total Sales
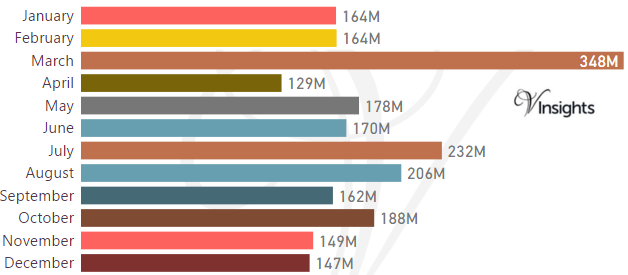
Stamp Duty Hike Impact
- March had property sale spike of £348 millions compared to £164 millions in Feb
- The impetus for it was to avoid the extra 3% in Stamp Duty Tax applicable on buying an additional home, being applicable from April 1 2016
Brexit Impact
- Brexit took place on 23rd June 2016.
- As can be observed from the month-wise break-up there does not seem to have been significant dip in property sales in the immediate aftermath of Brexit
- Year on Year the property market for Croydon has shown a decline of 8.6% over 2015
Total No Of Properties Sold By Property Type
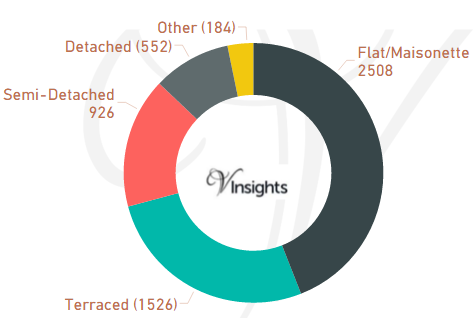
In Croydon the total number of properties sold in year 2016 was 5,696. The breakdown by different property types are:
- Terraced 1,526 (26.79%)
- Semi-Detached 926 (16.26%)
- Other 184 (3.23%)
- Flat/Maisonette 2,508 (44.03%)
- Detached 552 (9.69%)
Year on Year Comparison : Compared to Croydon Property Market 2015 in 2016
- Total number of property sales in Croydon has declined by 11.36% in 2016
- All property types have shown decline in number of properties sold except property type Other
- Other has shown significant increase of 66% over 2015
Average & Median Sales Price
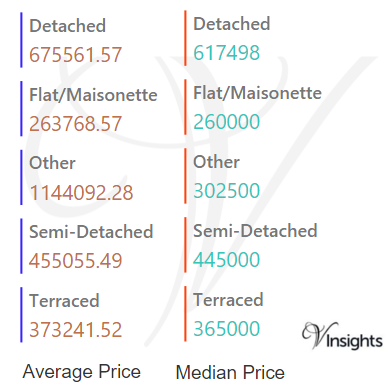
In 2016 the Average property price was £393 K in Croydon. The average property price for the different property types are:
- Detached £676 K
- Flat/Maisonette £264 K
- Other £1.14 millions
- Semi-Detached £455 K
- Terraced £373 K
The Median Price was £332 K. The median property price for the different property types are:
- Detached £618 K
- Flat/Maisonette £260 K
- Other £303 K
- Semi-Detached £445 K
- Terraced £365 K
Year on Year Comparison : Compared to Croydon Property Market 2015
- The average and median sales price across all property types have gone up except for others
- Others have shown sharp decline in average and median sales price
New Vs Not New Property Statistics
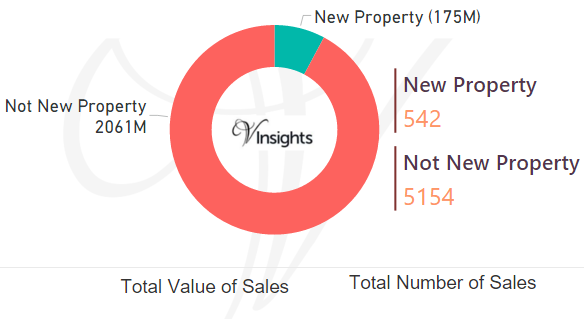
By Value Of Sales
- Not New Property contributed £2.06 billions (92.18%)
- New Property £175 millions (7.82%) giving
By Number Of Sales
- The number of Not New Property sold was 5,154 (90.48%)
- The number of New Property sold was 542 (9.52%)
Year on Year Comparison : Compared to Croydon Property Market 2015 in 2016
- New property market share in property market has not changed much in 2016 over 2015
All London Posts
9c7a3229-c926-4191-b45b-c60fb8b37711|0|.0|27604f05-86ad-47ef-9e05-950bb762570c
Story Highlights
- Bromley had total Property Sales of £2.67 billions in 2016
- The total number of properties sold in year 2016 was 5,380
- The Average property price was £496 K in Bromley, while Median was £415 K.
- Not New Property contributed 95.7% and New Property 4.3% by value
- Stamp duty changes caused monthly spike in March
- Brexit coupled with Stamp Duty played significant role in total sales value decline of 8.5% compared to 2015
Bromley is one of the Boroughs of South London. It had total Property Sales of £2.67 billions which was 18.72% of South London Property Market 2016.
Total Sales By Property Type
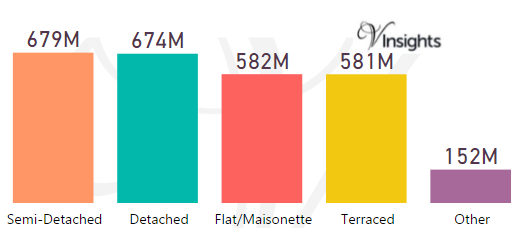
The split of £2.67 billions across the different property types are:
- Semi-Detached £679 millions (25.44%)
- Detached £674 millions (25.26%)
- Flat/Maisonette £582 millions (21.8%)
- Terraced £581 millions (21.79%)
- Other £152 millions (5.71%)
Year on Year Comparison : Compared to Bromley Property Market 2015 in 2016
- All the property types have shown decline in sales value
Bromely Property Market at Postcode Level
| Postcode |
Coverage Area
|
Local Authority Area |
| BR1 |
Bromley, Bickley, Downham, Sundridge
|
Bromley, Lewisham |
| BR2 |
Hayes, Shortlands, Bickley, Bromley Common, Keston |
Bromley |
| BR3 |
Beckenham, Elmers End, Shortlands, Eden Park, Park Langley |
Bromley, Lewisham, Croydon |
| BR4 |
West Wickham |
Bromley |
| BR5 |
Petts Wood, St Mary Cray, St Paul's Cray, Ruxley |
Bromley |
| BR6 |
Orpington, Locksbottom, Farnborough, Green Street Green, Chelsfield, Downe, Pratt's Bottom, Well Hill |
Bromley, Bexley, Sevenoaks |
| BR7 |
Chislehurst, Elmstead |
Bromley, Greenwich |
| BR8 |
Swanley, Hextable, Crockenhill, Swanley Village |
Sevenoaks, Bromley, Dartford |
| DA14 |
Sidcup, Foots Cray, North Cray, Longlands, Ruxley, part of Albany Park |
Bexley, Bromley |
| SE9 |
Eltham, Mottingham, New Eltham, Avery Hill (part), Falconwood (part), Sidcup (part), Chinbrook (part), Longlands (part) Kidbrooke (part), Shooter's Hill (part) |
Bexley, Bromley, Greenwich, Lewisham |
| SE19 |
Upper Norwood, Crystal Palace |
Bromley, Croydon, Lambeth, Lewisham, Southwark |
| SE20 |
Anerley, Crystal Palace (part), Penge, Beckenham (part) |
Bromley |
| SE26 |
Sydenham, Crystal Palace (part) |
Bromley, Lewisham, Southwark,Bexley |
| TN14 |
Cudham, Otford |
Bromley, Sevenoaks |
| TN16 |
Westerham, Biggin Hill, Tatsfield |
Sevenoaks, Bromley, Tandridge |
Month-wise Break-up of Total Sales
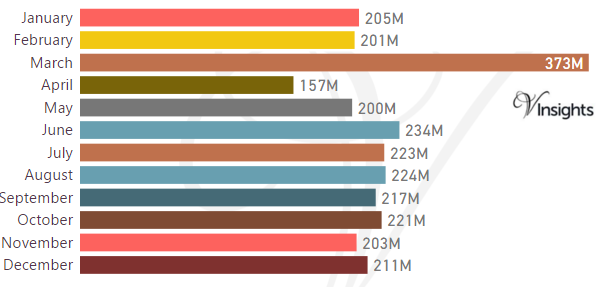
Stamp Duty Hike Impact
- March had property sale spike of £373 millions compared to £201 millions in Feb
- The impetus for it was to avoid the extra 3% in Stamp Duty Tax applicable on buying an additional home, being applicable from April 1 2016
Brexit Impact
- Brexit took place on 23rd June 2016.
- Year on Year the property market for Bromley has shown a decline of 8.5% over 2015
Total No Of Properties Sold By Property Type
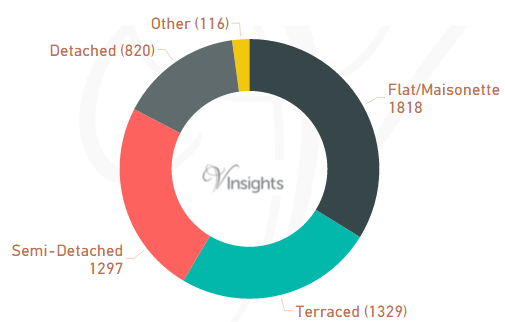
In Bromley the total number of properties sold in year 2016 was 5,380.
The breakdown by different property types are:
- Terraced 1,329 (24.7%)
- Semi-Detached 1,297 (24.11%)
- Other 116 (2.16%)
- Flat/Maisonette 1,818 (33.79%)
- Detached 820 (15.24%).
Year on Year Comparison : Compared to Bromley Property Market 2015 in 2016
- Total number of property sales in Bromley has declined by 15.5%
- All property types have shown decline in number of properties sold except property type Other
- Other has shown significant increase of 54.5%
Average & Median Sales Price
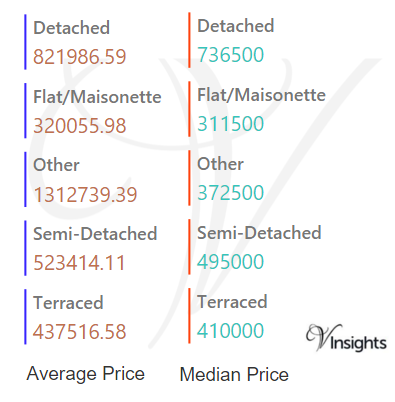
In 2016 the Average property price was £496 K in Bromley. The average price for the different property types are:
- Detached £822 K
- Flat/Maisonette £320 K
- Other £1.31 millions
- Semi-Detached £523 K
- Terraced £438 K
The Median Price was £415 K.The median property price for the different property types are
- Detached £737 K
- Flat/Maisonette £312 K
- Other £373 K
- Semi-Detached £495 K
- Terraced £410 K
Year on Year Comparison : Compared to Bromley Property Market 2015
- The average and median sales price across all property types have gone up except for others
- Others have shown decline in average and median sales price
New Vs Not New Property Statistics

By Value Of Sales
- Not New Property contributed £2.55 billions (95.7%)
- New Property £115 millions (4.3%)
By Number Of Sales
- The number of Not New Property sold was 5,135 (95.45%)
- The number of New Property sold was 245 (4.55%)
Year on Year Comparison : Compared to Bromley Property Market 2015 in 2016
- New property market share in property market has gone down in 2016 over 2015
All London Posts
8b62357e-f981-447b-bc77-cf22a6a662ed|0|.0|27604f05-86ad-47ef-9e05-950bb762570c